Wednesday 31 October 2012

01 November 2012: Nifty Elliott wave analysis: it gave a typical pullback toward N-Line of H&S pattern. As long as it is staying below 5630, it can fall towards 5567 levels.


You must read previous articles and watch above chart carefully to understand this article completely.
Today’s outlook: -
I have already said for the possibility of recovery yesterday. It was the most expected pullback. It recovered from 
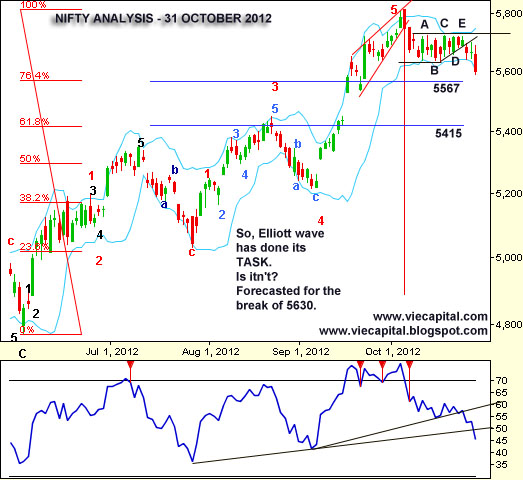
5583 and hit a high at 5624 levels which was still below 5630. It was technically designed pullback. Now, we can conclude that 5630 is missing so fall will resume. There are chances that we will see the levels of 5567 levels. This target or support has derived from Fibonacci series. Now suppose if it breaks 5567 then it will surely ready to hit 5500 levels. I strongly believe that sooner or later Nifty will even break 5500 marks to hit the target of 5450 to 5400 levels. I have already explained those target yesterday based on H&S pattern.
Have you observed one thing? We have a consolidation of 5630 to 5730 for 12 trading sessions. I have marks as consolidating A-B-C-D-E and we got final break of 13th trading session. It is giving us a hint that upcoming fall cannot be the normal one. Those who are buying should try being on cautious side. We need to remember that there where a phase when our market has discounted the fall of European and American market. Those days have passed and now we will see better correlation.
S&P 500 – I have said that 1475 will remain a yearly top when it was trading above 1460. I mentioned the importance of 1424 levels. Now S&P is trying to move towards psychological 1400 marks. I must say that 1400 has no technical relevance. We should expect dip towards 1385 – 1370 levels.
Now, you cannot say that we will not test 5400 of Nifty if S&P 500 slips by 2-3% more from current levels. So fall in Indian market is very likely. One can debate over duration of fall or one can talk about magnitude of recovery coming in between. Yes, it may happen but fall is expected.
United States has faced its worse natural calamity of history and it may make its impact on economy too. I always regret to apply brutal logic in stock market. We need to conclude that those destructions will generate some demand and consumption due to restructuring work.
One more thing, you need to watch out for Reliance today. I am sure you all must be knowing why I am saying this.
Regards,
Praveen Kumar

Tuesday 30 October 2012

31 October 2012: Nifty Elliott wave analysis: RBI action gave reason for Nifty to break 5630. It has broken and closed lower. Now we can expect more fall. Technical support comes @ 5567.


You must read previous articles and watch above chart carefully to understand this article completely.
Today’s outlook: -
From past three – four trading sessions I was discussing about a pattern which was ‘flat top and ascending lows’. It was a bearish signal and hence we have seen lower break. Yes, we betted for short trades on many stocks. It was explained based on RSI also which was giving all sense of weakness. I need to be honest that it was perhaps most patience testing market for direction. So, finally it seems that we got the direction.
I have already mentioned that RBI can have a room to give only 25 basic point CRR cut. Although, I still believe that CRR cut cannot help anymore. Note that we got 100 basic point of CRR cut and still repo remains unchanged. It’s really tough to be RBI governor. It is easy to sit in drawing room and do analysis but it is really very tough to throw some good plan to handle current situations.
For stock market, Nifty has broken 5630 and Sensex has broken 18500 levels to open newer levels for downside.
It was Elliott wave theory which gave me the hint of this fall. Now, it will be H&S pattern and Fibonacci series which can give me probable targets. Fibonacci series is suggesting for immediate support at 5567 levels, which can be tested by today only. Final support can emerge as low as 5415 levels only. On other hand H&S pattern is giving some basic calculation. Length of the head is 5815 – 5630 = 185 points. So the target should be 5630-185 = 5445. So anyhow we may move towards 5450 at least.  
There is another sense for H&S pattern. Nearly 80% of the time, stocks or indices try to retest N-line for once. It is suggesting me that Nifty can face resistance at 5630 levels. You can ask, will it come? Well, I am not very sure but chances are there for a bounce towards 5630. I am still quoting that it may come but it is not a compulsion to come. A price break down has already come and it will give its full impact.
Conclusion – we can expect a dip towards 5567 now and we will have technical resistance at 5630-5650 levels. A rebound is not a compulsion but it may deserve to come.
Regards,
Praveen Kumar

30 October 2012: Nifty Elliott wave analysis: Nifty has traded near lows’ but still not breaking 5630. Market is waiting for RBI monetary policy review today. Will it break 5630 marks? Let us see.


You must read previous articles and watch above chart carefully to understand this article completely.
Today’s outlook: -
Nifty is coming towards critical 5630 marks but never broken. It hit a low of 5641 on Friday, 5645 yesterday. We spend 14 trading sessions in the same range of 5730 to 5630. We have RBI monetary policy review today. I must say that market has denied too many negative news flows in recent past. Nifty has digested the fall of reality stocks, banking stocks and massive dip of Dow Jones. Let us look consolidation in another way too.
We have 14 range bound session after hitting top. I can assume that it must have thrown all weak bulls of the market. Now it is just waiting for some trigger to move northward. It can be RBI monetary policy. Alter way, if rate cut does not came as the market is wanting then it will break 5630 today. We all know what can happen after the break of 5630.
So finally, we still need to wait for 5630. Now, what to expect from RBI monetary policy? I read yesterday’s economic survey report. They have reduced GDP target substantially from 6.50% t 5.70%. Paper has shown concerns over inflation and growth too. Unexpected is nothing but I am sensing that we will not get any rate cut. Even if we get then it can just be 25 basic points of CRR cut. 50% traders are expecting 25 basic point repo rate cut and 25 basic point CRR cut.
What is meaningful? Cut in CRR does not have its meaning. Without a cut in repo rate you cannot justify these actions. If RBI wants to cut any rate then it should be repo rate or both. Cut only in CRR is just not making any sense.
Apart from this, I am lot scared about Kelkar committee report. Our market might not be ready to digest higher fiscal deficit. As of now market has not reacted yet.
Technical charts are stopping all it’s conclusion at 5630. So I have nothing new to add. We might see silent opening and silent trading before RBI policy.
Have a great trading day,
Regards,
Praveen Kumar

Monday 29 October 2012

29 October 2012: Nifty Elliott wave analysis: It has saved 5630 marks again and hinting for traditional bounce. Chances are high that a dip will come soon to break 5630 and shift to panic gear.


You must read previous articles and watch above chart carefully to understand this article completely.
Today’s outlook: -
Nifty came at 5641 on Friday but then bounce to close 23 points higher from intraday low. Low of 5630 was again very close to 5630 levels so it was another bounce with came from those levels. It is a much known support now and giving signs that it will not break so easily. Wave theory is sill hinting that sooner or later it should break on lower side. Even many technical indicators are also suggesting that the same. You can check RSI movement on the chart.
It is not that only fundamental is going to play its role. We have RBI monetary policy review this week. Market is expecting a lot from those. There is a sense that hope from RBI is saving this market from any fall. Some might be saying that CRR cut is coming and some might believe that repo rate cut will come. These are just talks and we need to see what coming in actual sense. It does not matter what is coming. What it important is that how can long can those save the technical levels of indices.
We need to remember that our market has not respond with 3% from of American market. This under performance will fill up some time. An H&S patterns are suggesting for some lower target but only if we break 5630. So, technician has again focus on 5630. All studies are sticking to this point. It seems that Nifty is in Bermuda triangle where it is neither able to find direction nor able to move out.
If you remember, I have discussed about a triangle on Friday. Yes, that ascending triangle has broken in the expected way. It is suggesting for a dip. I am getting a hint that even after bounce, this market has to move lower by later this week only.
Conclusion for today – It is hinting for flat to positive start. Technical resistance will emerge at 5700 to 5730 levels. I am also tired of waiting for the break on any side. So let us watch for the break. Do note that 5630 is a ‘make or break’ levels.

Regards,
Praveen Kumar

Friday 26 October 2012

26 October 2012: Nifty Elliott wave analysis: We spend whole October month series in 100 points of range and still no conclusive direction. Hope to get something today?


You must read previous articles and watch above chart carefully to understand this article completely.
Today’s outlook: -
Nifty has definitely irritated most of you in past three weeks of trades. It was perhaps most meaningless expiry we have seen yesterday. One can say that even after close above 5700, we are direction less. One can be right to some extent. Today is important day in term of technical chart. We are on 15th from the top of 5815. Most important, we are on 13th day in 100 points of ranges on Nifty. Will it give some meaning now?
I can sense that we are just on the verge of breaking this range. I am not betting which side it will break. You can clearly see the pattern drawn on the chart. From past six trading sessions it is flat top and rising bottom formation. This is an example of contracting triangle. Do not conclude that it is a bullish sign. I have given the way contracting triangle (with flat top and rising bottom) performed most of the time.
I am accepting that I am always biased towards Elliott wave theory to get direction and I like to see this time also. What it is saying now: -
“We may come near to 5730 (without violating tops), and fall can begin anytime.” This pattern possesses meaning whenever it forms immediately after hitting a short term top. There is a small question. When everyone knows about the 5730 then market may try to misguide. In such cases also closing will not go above 5730. For intraday, Nifty will have support at 5680. If it sustain below 5680 then we may see the dip towards 5630. Opps !!! Will it hit or miss? Too be honest, I do not know yet but wave theory is giving we that we will get final breach of 5630 any day any time.
S&P 500 – When it was at 1460+, we have quoted that 1475 may remains yearly top and hence correction deserves. It came off and came at 1410. Be ready to see 1385 also in small time span. I will update more. I would be happy if Nifty also would have moved in that way.
I cannot hesitate to say that this is worse approach by Indian market.


Regards,
Praveen Kumar
www.viecapital.com

Thursday 25 October 2012

25 October 2012: Nifty Elliott wave analysis: Nifty has missed 5730 and traditionally come off from resistance levels. It has not broken any side. Will the dip in US market provide trigger?


(My Official web www.viecapital.com is facing some server error.)

You must read previous articles and watch above chart carefully to understand this article completely.
Today’s outlook: -
Nifty remains in the range as it has slipped again from the resistance levels of 5730. Our market is opening after one day of holiday and today it derivative expiry. US market slipped nearly 2% in past two days. Well, these fall has hardly make its impact on Asian indices. Fall is coming on poor corporate earning and some fear of slowing economy. When US market is on fall, we should react but extent is still beyond estimate. Take a note that our market has not reacted even on Friday’s fall of Down Jones. So net basis, our market has not reacted for nearly 450 points of fall on Dow Jones. How many times we have seen this in past?

We are say that we are in 100 points of range with higher end at 5730 and lower end at 5730. Practically, this range is even smaller for trading as most of the time is fall from 5720 to 5660. We, need to note that we have spend 13 trading sessions after hitting 5815 levels and it has spend 10 trading sessions in the zone. I can say that it is turning out to be most frustrating zone. We may see some dull opening today, may be near to 5660. Then, derivative expiry will play its role as I cannot deny the possibility of some short covering.

Looking on global undertone, I am sensing that it has test the patience but it has to break and direction will be probably down. Technical indicators has slipped and indicating the fall. I need to be honest to accept that fall is not coming in the expected way. One can conclude that weakness of technical indicators has only able to push us in range but not the direction yet. To a big extent, it is true till now.

From past five trading session, we kept on hitting higher lows but trading bad is turning narrow. It is giving us a hint that we might break this range anytime now. When will it break? Only time can answer such questions. You can look on technical chart; I try to make possibilities with RSI. If this weakness sustains and we fail to stand above 5730 then we must see a move towards 5500 levels.

For today trading, keep an eye on 5670, beak of those will give us a move towards 5630 and then market will be decisive. On higher side 5730 is the only stiff technical resistance.
Let us see if we get break of range today. I can only say that 5630 has yet to play big role before any remarkable fall.

Regards,
Praveen Kumar

Tuesday 23 October 2012

23 October 2012: Nifty Elliott wave analysis: it has saved 5630 and now ready to break 5730 on higher side. Even after break it will not give great move. Expect 5757, or max at 5775. Intraday fall is expected from higher levels.


You must read previous articles and watch above chart carefully to understand this article completely.
Today’s outlook: -
Yesterday was supposed to be the last best opportunity for nifty to break lower. It has denied even after massive dip in US market. Last night, US markets were flat while European market has lost some more ground. Can we expect some impact on our market? Well, we may not see any great impact. We are ready for another dull opening. After opening, I like to say that you should wait for the higher break of 5730 levels. (I have already discussed the importance of the range of 5730 to 5630).
Crossover of 5730 will give us a move towards 5757 levels. Any traded above 5757 to 5775 will face massive resistance. I can conclude that use levels above 5757 to short indices and prefer to press stop loss above 5775. We have a chance to see intraday dip if such higher levels comes. (Note- above are quotes for Nifty spot). Remember today is 13th trading day after hitting a high at 5815 levels.
Suppose, if it fail to break 5730 again then it will repeat the same story. I have already plotted seven waves consolidation. We still need to see the outcome of this consolidation. Charts are showing that it is taking lows higher. Till now, traders get excited by 50 points of rise and get depressed with 50 points of fall. Fact is that we have not seen anything great in October month series. This is giving me a hint that we may end up things on wild note.
I may say some positive crossover for Indian market but unfortunately I cannot repeat same statement for global marks. S&P 500 is ending up near 1432. It is near to the support of 1424 but not going to favour bulls to any great extent. My view remains same that 1475 may remains a yearly top. Break below 1424-1418 range will result 2-3% further dip. S&P 500 may see some decisive fall due to poor corporate earning. Question is that can we stand against all those odds. No, surely not. It does not matter how much higher we are moving but fall is unquestionable.
Just think, Greece gained 65% from its recent lows. Does it make any sense?

Regards,
Praveen Kumar

Monday 22 October 2012

22 October 2012: Nifty Elliott wave analysis: Will the big fall in US market give us a trigger to break below 5630? Even if it comes then also it may not be that easy so still watch out for 5630.


You must read previous articles and watch above chart carefully to understand this article completely.
Today’s outlook: -
Nifty has neither yet broken 5730 on higher side nor 5630 on lower side in past nine trading sessions. It is more than enough to irritate traders. We have a high at 5711 on Friday with a low at 5660. We got single biggest fall of past four month in US market. Question is that will that be enough to give break below 5630 on Nifty? We can speculate about but those but I am still feeling that it may not be that easy. Although, I want it to break to move out of this trading ranges.
What has driven fall in US market? It was poor quarterly numbers which hurt the sentiments most. We must note that even European market has closed 1% lower. We need to note that all those concerns are coming after best efforts by policy makers. I have earlier also that what’s if they fail? Can we expect another set of stimulus? No one wants to think even in that line. We cannot run away from those ugly situations in coming future but it will take its own time to act.
S&P 500 – It was quoted for a bounce on the save of 1424 for a target of 1460. It did its target and then took the expected down turn. It came again at 1432 levels. Study turns same again. Now technical support will again stand at 1424 to 1418 levels. This is crucial support for short term. Once we slip below this support then we can expect a further fall towards 1400 to 1385 levels. We need to note that US market is perhaps one of the worse earning session in recent time. You can say that this is perhaps worse earning in last 10 years.
For Indian market, Nifty will again try to find support at 5630 levels. Looking on SGX Nifty it is looking like that we will see the opening near to or above 5630. Trading will be very interesting after that. FII money flow has lost its intensity in past few days. We got 2 billion dollar in Indian market in current month series and index almost remains unchanged.
For today views are as follows for trading. Do not short near 5650 to 5630 ranges. It is better to wait for the break below 5630 to initiate fresh shorts. Who knows if it takes another return from those levels as it has happened too many times. Derivative expiry will start making impact from today onwards. Will we get expiry near 5555 levels.

Regards,
Praveen Kumar

Friday 19 October 2012

19 October 2012: Nifty Elliott wave analysis: Forming an indecisive “W” pattern. Trading range of 5730 to 5630 will remains critical. It is still not clear about the direction of break. Even after gains FII and DII both has net sell figure for last session.


You must read previous articles and watch above chart carefully to understand this article completely.
Today’s outlook: -
I said that 5630 is now ‘make or break’ levels. Few days back also I quoted that Nifty is bound to see pullback as long as it is saving 5630 levels. From higher levels, if it fails to sustain above 5730, we are bound to see selling. We can conclude that actions has restricted in 100 points of range from last eight trading session. I need to be honest that it is not easy to take directional call in this kind of market. Those are officially confirmed by charting pattern. Those who know technical must be aware about “W” pattern. I am explaining also. Some can name it as double – bottom and triple-top pattern. Bears took two attempts to for tow lows and bulls put three attempts for three top but both failed. Simple rule of technical analysis suggest that one should not deal in this 100 points of range. Characteristic will be – you expect up, it will go down and you expect down, it will go up.
It is a better idea to wait for the break of extreme ends of range. If you are taking buy or sell then those might not have better technical confirmation.
There is another way to read the current structure. Those call called “bar set up’. On 8th October it has formed a range of 5752 to 5666. Take a note that we never able to move out of those ranges after that on decisive basis. Bar set up theory suggest that until we break on any side we cannot claim for direction.
Now, then which study can give me direction? Well, there can be answer based on Elliott wave theory. Those are suggesting that this is the range of consolidation. This consolidation can be 5 waves or 8 waves. We have completed 4 waves till now. We may see the beginning of 5th wave on down side. It is early to conclude and so I can be better position to answer those after today’s closing levels.
S&P 500 – I informed that it has formed a buy with a save of 1424 levels. This buy was applicable for the target of 1460 which it has already done yesterday. Now it is again in the zone of resistance near 1475. Failure of 1475 will declare this as yearly top. Today is 25th anniversary of single day biggest drop of Dow Jones.
Another important point to note is google and Microsoft result. Both were looking equally horrible. Was that the base of rally? If yes, then market men need to think what they are doing.
We got something on EGoM over telecom policy yesterday. Those push many questions rather than answer. I can say it is still unclear. This is just my view as I am not telecom expert. Let us see how stock will react.
Regards,
Praveen Kumar

Thursday 18 October 2012

18 October 2012: Nifty Elliott wave analysis: it has entered in the support band of 5638 to 5630 and then a mild bounce. I am repeating again that we must watch a break below 5630 to see further fall. Buying intensity has reduced by FII.


You must read previous articles and watch above chart carefully to understand this article completely.
Today’s outlook: -
Nifty kept on trading near to 5630. It was still interesting to see that it has not broken 5630 levels. It is going to be challenging today also. I am considering that 5630 will act as a ‘make or break’ levels. It is also true that Indian market is underperforming almost all major global indices. On other hand FII flows has suddenly reduced. Just think that Nifty lost 180 points only when FII reduces their money flow. What if they really start selling?
I must say that this underperformance is not normal as no one knows that exact reason of this kind of performance by Indian indices. Note few fact – Dow Jones is down by 1% from its recent peak and we are down by more than 3%. Indian indices are not rising after those so called reforms step taken by government of India.
Technical charts are not suggesting for threatening fall but things will be changed if it breaks 5630 levels. Charts are suggesting for the target of 5500 on the break below 5630 levels. At best I can say that it will have an intermediate support at 5580 levels.
Technical indicators like RSI and MACD is on concerning shape if not alarming. There is something which is not giving comfort to this market. We have seen silence is US market last night. S&P 500 has closed on its dot target of 1460. This buy signal generated when it was saving 1424 support levels.
As I am saying from past few weeks, S&P 500 will have a great challenge to cross above 1475 levels. Take a note that if it failed to cross above 1475 then it may become the yearly top. I do not know what is happening on fundamental front to stop rally. I never felt that QE 3 kind of things can really support stock market. Sooner or later, Stock market has to accept that we cannot rise too much with stimulus supports. Lastly, companies have too come with its performance and that is most important. Corporate earning is also sluggish till now across the globe.
If things remain same then we can say that it can be the reason for profit taking. One can say that corporate earning is not so concerning in India market. Well, even though we are not getting that comfortable higher guidance which is a requirement when we are near to yearly high.
Am I talking about a big and scary fall? Surely not. I am still feeling that after one dip our market may bounce again. For today, I will again watch out for 5630. I am not going to initiate any fresh short unless it sustain below 5630. I do not think that Nifty can easily cross 5700 levels now. Take a note that we have stiff resistance only at 5730 levels.
Let us see.
Regards,
Praveen Kumar

Wednesday 17 October 2012

17 October 2012: Nifty Elliott wave analysis: It has missed 5730 again and came close to 5638-5630 support band. We have seen definite signs of weakness with stiff resistance at 5700 and 5730. Will it breaks 5630 today?


You must read previous articles and watch above chart carefully to understand this article completely.
Today’s outlook: -
It was surprising to see the market falling with rapid intensity from higher levels yesterday. There were no big reasons for sell off. Our market slipped with almost all global market was going higher. This kind of fall comes when market men think that they have fulfilled their apatite. If this is true then next question is that is it possible @ 5700 of Nifty? Let us do not be in hurry. We need to see follow up trades. After a long time FII were net sellers of Rs 204 Crores.
Technical charts is still confirming for weakness. I am already repeating the importance of 5730 and 5630 from past few trading sessions. Now we have to watch for the reaction at 5630. It will be important to see if it breaks 5630. We may have some intermediate support at 5580 levels but final target for the fall can be only at 5500 levels.
There is a visible H&S pattern on Nifty daily charts. You can read those on the given chart. It is explained with Elliott wave theory also. It is important to note the as long as 5630 holds, we can only speculate about the break on down side. I say, let it convert into reality. I am sensing that many short term traders would have placed stoploss just below 5630 or below 5600. So it is for sure that market will turn violent on that kind of break down.
What’s if market open higher? Looking on SGX NIFTY, it seems that we will open little higher. Of course not as strong as SGX is hinting. On higher opening also, Nifty is likely to face stiff resistance at 5700 levels first and then at 5730. I do not think that stocks can change its behaviors in one day only.
There are many stocks which are trading at monthly low or near to monthly low. Stocks like Reliance and Infosys are examples. Take a note that both are considered as blue chip of the market and both has declared its result in past few days. Somehow I am feeling that market wants to say something in advance. I can able to sense those in coming few days. My point is to watch out for follow up selling if comes today.
Yesterday, it was updated for S&P 500 for a bounce towards 1460. It has saved support of 1424 and moved towards 1460 although it is still missing target as dot. Well, those bounce was expected but came in a rapid way. Take a note that it has stiff resistance at 1475 levels which may remains untested in any bounce.

Regards,
Praveen Kumar

Monday 15 October 2012

16 October 2012: Nifty Elliott wave analysis: Muted sessions can drive market in any direction. As long 5630 hold, it can rise but resistance will remain at 5730 levels. Will it cross 5730? It is still to be watched.


You must read previous articles and watch above chart carefully to understand this article completely.
Today’s outlook: -
Nifty has saved 5630 marks again. It has not even crossed 5700 marks while 5730 was the most meaningful resistance. Reliance has delivered figures inline with expectation. Well, hopefully market will not punish the stock. In another crucial event WPI number came little higher than expected. I am not concluding anything about RBI’s upcoming monetary policy. Can we expect rate cut based on those? May be not. I am still sensing for the room for rise in inflation figures. Even if it does not go above 10% then also it will be much higher and remains beyond comfort zones. I am crystal clear in my views that inflation will move higher.
Wave theory suggests that levels of 5630 to 5730 will be very crucial. Now we have two ways for trades : -
One is, as long as 5630 levels hold then we will see pullback towards 5730. Other way is, if it fails to cross above 5730 then it will face selling at higher levels. Figures of 5630 and 5730 need to be on decisive basis.
Technical indicators are suggesting that we are now on mid way. It is very clear that break levels has not came on charting side. Momentum indicators are weak but not enough to suggest for big fall yet. As 5630 holds so we need to believe that this market will have a room to make a fresh up wave. Although it may not be so easy but charts are saying for those kind of response.
What’s if 5730 crosses? We need to believe that if Nifty successfully crosses 5730 then we need to believe for higher target in the zone of 5780to 5800. I can equally conclude market will not stop at those levels. It may make a fresh crossover to get a newer 52 week high.
Alter sense, if we start trading below 5630 then we may see it heading towards 5500 levels. I am sure that now everyone is repeating this statement. Well, as it is most talked levels so be carefully and apply this study on decisive basis.
S&P 500 – I have said in past that if it fails to cross 1475 then it may remains a yearly top and I have quoted for support at 1424. We must note that bounce from support is not very unusual things. One bounce is coming but that may not last longer. Well, so far it is the beginning of bounce in UA market. Right now it is looking like to revisit the levels of 1460. It is still tough to conclude if that can be a trade or not. If one wants then it can be.
Let us come back to some sectoral performance. If indices have to rise then it cannot be possible without support from banking stocks. For today, it looks like Reliance will add 1-2% higher trades backed by results. So far from 5680, it is looking for cautious up as long as 5630 hold. On higher side expectation can be for 5725-5730. We will get a decisive crossover only after 5730.

Regards,
Praveen Kumar

Sunday 14 October 2012

15 October 2012: Nifty Elliott wave analysis: So far 5730-5732 acted as stiff technical resistance and support stand from 5638 to 5630. Will that save for long? May be not. Market is now waiting for reliance numbers.


You must read previous articles and watch above chart carefully to understand this article completely.
Today’s outlook: -
Nifty has saved 5630 on last Thursday but unable to cross 5730 resistance marks on Friday’s trade. Market was waiting earning and guidance. It is coming that till now I am really disappointed with those. I must say that I was expecting those disappointments. Take a note that I am not saying any thing good or bad.
Optimism is saving the support of 5630 and the fear is causing for the failure of 5730 on higher side. In that kind of development, nifty has formed H&S pattern but those will be applicable only if it sustain below 5630. Big question is that will 5630 break? I read many technical indicators on Nifty chart and found that a chance of break below 5630 is very bright. If that happens then we may see some levels near 5500 in coming few days. It will not be a one way blow so we may have some intermediate support at 5580-5570 kind of levels.
MACD and RSI is giving signs of weakness and this weakness can be concerning if it breaks 5630 levels. There can be the possible consolidation range between 57300 to 5630. It is interesting to see that market took support at 20 days moving average many times in past. Even now 20 dma falling at 5630 only.
It not that only Indian market is getting disappointed earning numbers. It is happening all across the globe. Prime reason is that many stock prices are already higher in past few months of trades. I have given emphasis on 1475 of S&P 500 in past few days but that remains uncrossed yet. Now even S&P 500 has support at 1424 to 1418 levels. Break of that may push some short term sell off. So I feel that we are on critical week of trades.
As per individual stocks are concerned then I can conclude that at least technology stocks are not comfortable at all after Infosys earning. It can be only pharma stocks which can have some defensive buying.
One must note that wave developments are going with rising channel with a-b-c count only. If anything comes decisive then I will plot it on my chart. There is another important event today and that will be Reliance quarterly numbers. It will come after market hours. Technical charts are suggesting for support at 808-805 levels.
For Indian market, nifty will look for support at 5630 and for USA, S&P 500 will look for support at 1424-1418 levels. European market is already at uncomfortable levels to say for stability. DAX will have technical support at 7160 for short term.

Regards,
Praveen Kumar

Friday 12 October 2012

12 October 2012: Nifty Elliott wave analysis: Nifty has saved in the mentioned support to 5638 to 5630 levels. Life for this rebound will depend on up coming quarterly numbers. Technical resistance will be at 5732.


You must read previous articles and watch above chart carefully to understand this article completely.
Today’s outlook: -
I had mentioned the support to 5638 to 5630 few days back. It was also quoted that break below 5630 will take the nifty down towards 5500. Well, Nifty has bounced from 5636 and rebounded strongly backed by massive short covering and buying in banking stocks. It was another set of reforms which has helped the sentiments. Question is that is it really changing anything?
I still feel that charting is suggesting that we need to wait for the cross of 5730-5732 resistance zones to bet for any further strength. A pullback from 5736.95 came and there are chances that it will end near 5730. Suppose if it manage to sustain above 5730 then we can expect levels of 5780 to 5815 levels.
Opening is expected be influenced with Infosys quarterly numbers. One must note that the support of 5638 to 5630 will be a valid support for today’s session. There might be the week end factor also. Do take a note that we have Reliance numbers to come on Monday market hours.
I have discussed about S&P 500 few days back. I said that failure of the cross of 1475 will result the yearly top. There is a technical support at 1424 to 1418 levels. Now it is at 1432 levels. So upcoming few trading sessions will be very important US market.
I have already raised enough question market on QE 3. Now, it seems that market is also sensing that it is actually not going to fulfill the purpose. I can conclude that US people are busier with US president election while they should be thinking about economy. I am sure that many people might know the actual problem. If they know then they will surely going to react on some time.
European market is also not very comfortable after ‘unlimited bond buying’ program. I have just one view that policy makers have bought some time to face the problem. Time is coming closer and we may expect sharp reaction in coming days. It is equally true that we have not got any kind of technical alarm yet.
So, for us, watch out for quarterly numbers of Infosys and HDFC bank. There will be another set of IIP data coming today, which might be negative again.

Regards,
Praveen Kumar

Wednesday 10 October 2012

11 October 2012: Nifty Elliott wave analysis: Nifty is moving towards the support at 5630 levels. Break below 5630 will cause further dip towards 5500 levels. Market is eyeing for quarterly figures.


You must read previous articles and watch above chart carefully to understand this article completely.
Today’s outlook: -
It was no different mood for market yesterday. It has slipped again with some remarkable fall in many reality companies. I must say that those are deserving fall. It is a common suggestion that one should try to maintain distance from all reality companies for few days/weeks. I read a lot about DLF in news papers. If those are true then just think how safe your investment can be. Those who are reading me regularly know that I have already criticized these companies long back and put them in ‘no investment zone’. It started from DLF from 800 and ended with Unitech from 90.
Now, back to technical, I have two very popular indicators which I discussed in past 3-4 days. One is RSI and other is MACD. Both indicators are giving signs of weakness and backed on those I have acted on short trades from higher levels. I tried few shorts earlier also but failed. Technical trend line studies are suggesting that we will have decisive support at 5638 to 5630. I have already quoted this support three days back only.
Now suppose if it breaks 5630 then it will have greater chance of hitting levels towards 5500 levels. I must add that market is going to be influenced a lot by speculation over upcoming Infosys and Reliance quarterly numbers. We have got so much of poor IIP data that I have a doubt about result now.
I have also quoted about S&P 500 (USA) earlier. It was stated that if it fails to breach 1475 then it may remains yearly top. Right now when I am compiling this article, S&P 500 is at 1433. We have crucial support at 1424 to 1418. Break of this range will create problem even for US market. So it was other way to look the market. I conclude something first on US market and then correlate this with Indian market too. This gave me better confidence to deal.
There was another development which deserves to be mentioned. S&P has warned/threatened India for a possible downgrade in 24 months time. Note down two important points. First is, we will be in election in 24 months time and do not expect speedy reforms. Every ruling party in the world is doing this and India will follow the trend. Secondly, we know that Indian economy has lots of hurdle. It deserves downgrade but not by leaving rest of the nation’s rating unchanged. I am also saying that our economy may be in trouble. Well, but there is another fact that Europe is already trouble. Rating agencies are always trying to be brutal with India. Current rating for india is BBB-, which is poorest rating for investment. A downgrade means “JUNK” rating for India. Common, this is not fair. You cannot compare India with Greece.
Have you noted one thing? All Indian experts were bullish and DII’s figures were on constant sell side. Almost all rating agencies were trying to be negative with India but FII’s were on buy side. Interesting, isn’t it?  
Regards,
Praveen Kumar

10 October 2012: Nifty Elliott wave analysis: Is the current valuation justifying stock price? Wave theory is denying those. It seems that short – term top has formed. Support for NIFTY @ 5630.


You must read previous articles and watch above chart carefully to understand this article completely.
Today’s outlook: -
Yesterday I have quoted as, “It may open higher by 25-30 points, say @ 5700 levels. Then it may fail at 5725-5730 zones at the max.” It hit a high @ 5729 and then slipped. Apart from that, 2 days back it was quoted that if S&P 500 (USA) fails to cross above 1475 then it may also act as short term top. Those were two recent finding of wave theory applications.
I am already saying that market should not try to discount up coming quarterly numbers. It seems that now market is sensing those. I like to draw your attention towards MACD which has given a sell signal in the last trading session. We must note that last sell signal has seen a divergence. We have three sell on RSI also in past few weeks. It cannot be easy to surpass this kind of trading signal.
I am still not saying for much bigger cut in market. I like to see the market behavior in the zone of 5638 to 5630. If it break and close 5630 then I would be in the position to say for concerning dip. I always prefer to take market in a phase manner. Current phase seems to be a shaping up for weakness.
On the higher side we will face stiff trading resistance first at 5730 and then at 5750 levels. Cross over of 5750 will again lead us towards 5800 levels. In the down side, if I consider the beginning point of this rally from 4770.then even 23.8% comes at 5567. So we are still too far from any crucial Fibonacci support levels.
There are few more important developments. Euro zone is again giving all signs of burning. I have already criticized Mario Draghi when he comes out with his great idea of ‘unlimited bond purchase’. Those has postponed the problems but not solved. At some point of time Euro zone has to face their bitter truth. This is not the one worse thing. Next was QE 3. Now what people are waiting for? QE 4? These are just the waste of money. Take a note that higher stock price cannot be the guarantee of generation of job. It seems that policy makers are running short of ideas to come out of this phase. I have one such, start creating government based job and stop relying on private hands. It will help to end the fear in economy and will able to rotate the money cycle. This may take time but I do not think that we have too many options now.
Lastly, I am assuming that only the ‘announcement of FDI’ can not solve problems for India. You need to create good environment to attract FDI. Where are those environments? Now a day, it seems that we are getting newer topic for corruption on weekly basis. Stock market can go up or down depending on many factors but economy always need to put on right track. That track is still missing even after efforts.
Bottom line is that I want to say that upcoming quarterly numbers and earning guidance may fail to fulfill the apatite of the market.