Monday 31 December 2012

31 December 2012: Nifty Elliott wave analysis: It may remains directionless in 30-40 points of trades. US Fiscal Cliff – looking like US government is heading for Hindi film climax!!!


You must read previous articles and watch the given chart carefully to understand this article completely.


Today’s outlook: -
Wishing all of you and your family a very happy 2013!!!
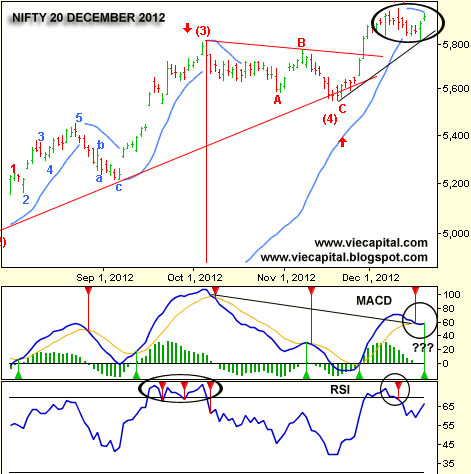
Today is the last trading day of the year and month as well. Nifty has not done anything in December month till now. It gave buy and sell signals through out the month. High and low for the month was at 5823 and 5965 which is almost 140 points but in actual sense we hardly trade beyond 50 points of trades. Very surprisingly, FII has invested more than USD 2.5 billion in this choppy range also.
Above all, we kept on speculating on the deal over US fiscal cliff. Till now, nothing is coming and we are just few hours away from deadline. It is looking like US government is more inspired from Hindi films and preparing for last hour climax. It is not going to allow anyone to relax before New Year; we can just wait for the outcome.
Technical charts are indicating for a flip-flop. Above 5923, it will indicate for a rise towards 5965 or cross over. In the lower side it will have trading support at 5880. I have already said for the trigger as ‘5minutes trade below 5838 for fall. It didn’t come yet but this condition for fall is still alive.
Technical indicators are giving signals that we will not move out of this zone very soon. This is limiting the signs of broad movement, I need to say that ‘negative divergence’ of MACD and VIX has given signals well in advance that we may not see good rise from 5900. So far, I can say that it was the month of consolidation.  


Conclusion Nifty: almost every single market is waiting for the outcome of USA fiscal cliff. There is not deal yet and not even the signs. Technical resistance for Nifty will be at 5923. Cross of 5minutes above 5923 will give us 5950 to 5965. In the downside we will have support at 5880 and then finally at 5838. Odds swings will continue in this way. Either it is going to repeat January 2012 or January 2008.   .
S&P 500 – It came very near to my first target at 1400. I wish if Nifty would have moved in this way. Charts are suggesting that we can have last hope as 200 DMA for S&P 500 which is running in the zone of 1390 to 1385. So whatever be the outcome of US fiscal cliff, it need to save 200 DMA on closing basis. Will it save? Let us see.  
Regards,
Praveen Kumar

Friday 28 December 2012

28 December 2012: Nifty Elliott wave analysis: It was another oscillation on the failure of higher threshold at 5923. Technical support in the zone of 5838-5823. It may remain directionless.


You must read previous articles and watch the given chart carefully to understand this article completely.


Today’s outlook: -
Nifty has opened higher yesterday but it was never above 5923 expect first second of trade. We have seen the result of this failure in second half. Technical charts are showing that we are still the shown downward channel. I have already said that this market will give the outcome what is not looking like to come. You expect up but it will come down, if you expect down it will go up.
We need to note that it is more than a month that we are still trading near to 5900 levels. It took few attempts to cross higher but failed every time. It has saved lower band too. At current levels we cannot say anything confidently that it is going to give breakout or breakdown. I am giving higher priority to the channel which it is forming on the chart. With that downward channel support is also shifting lower. So we need to see the levels of 5838 to 5823 as support band. Suppose, if market goes below this support band then it will try to take a decisive down. I must say that technical indicators had given buy and sell both in past few weeks but all has failed. As of current formation, it is giving me a direction down but it is not going down yet.
MACD and RSI are still trading with moving weakness. I am giving some priority to 20 days exponential moving average. After crossing higher above 20 EMA, it is stay above this only. Now if it breaks it on the lower side then 4-5 days of downside it unavoidable.   
Conclusion Nifty: We have not got the clarity over US fiscal cliff situation yet. I have already said that market will not be comfortable unless we see some decision in USA. Nifty failed to sustain above 5923 and closed with a sell off. It turns out to be the dead expiry month. I am sensing for flat opening and directionless movement. If it trades below 5838 for 5 minutes then it will invite some decisive sell off but even 5838 looks too far from here.  .
S&P 500 – I have already discussed for resistance at 1445 and a possibility to test 1400. It hit 1400 almost in the last trading session. Take a note that it is still not strong enough to buy. No solution is coming over US fiscal cliff till now. Market is expecting a solution but it is not getting. With yesterday’s strong pullback one need to see the follow up of trades. In a clear way, if S&P 500 closed positive today then a rise is expected again else fall to hit 1385. You cannot conclude every single day.
Regards,
Praveen Kumar

Thursday 27 December 2012

27 December 2012: Nifty Elliott wave analysis: Nifty moved higher above 5900 marks. Short covering may give us a rise towards 5950+ levels. Crucial support in the downside will be at 5880. Whole month it was 50 points higher or lower from 5900.


You must read previous articles and watch the given chart carefully to understand this article completely.
Today’s outlook: -


It was giving all signs that it has higher probability of breaking 5838 but it has saved. Once it has saved then it has given what it was supposed to give. For whole month nifty is moving either 500 points higher or 50 points lower from 5900 marks. This is looking as consolidation. The out come of consolidation can be encouraging if it manages to cross 5967 levels.
We have derivative expiry today. If it has to break 5967 on higher side then today will be the best to do so. I must say that I do not think that we should give a positive discount to US fiscal cliff problem. It is still true that if market is discounting then it must know the outcome better than anyone else.
One can look at the chart. There is a short term channel where it is forming lower low and lower high. It is very close to break it on higher side. This is suggesting me that if it manages to sustain above 5924 then we have higher possibility of hitting 5950 to 5965.
We need to be aware from another fact also that this market will do what least people will expect. Although charts might be say for rise but I can say that movement will be very limited on higher side.
I have plotted 20 days exponential moving average which has acted as good trading support. Remember 50 points up or down can change views for trading only. For direction, we need to see the break above 5967 to come in reality.


Conclusion Nifty: It has saved 5838 and closed above 5900 marks. Now it has again opened the room for a move towards 5950 to 5965. We may see rise backed by short covering on derivative expiry day. I need to be clear, I am still not hoping to any decisive crossover even on higher side. Until we get any solution over US fiscal cliff we may not able to see decisive breakout. Rest of the Asian market is doing that on different reasons. You will expect up, it will go down and you will expect down, it will go up.   
S&P 500 – It came very close to 1418 support. It is already trading with nervousness. This market is my prime concern. Once it starts closing below 1418 or if it start trading below 1412 then it will see a decisive fall. Fall can hit 1385 levels. I have already suggested for resistance at 1445.It will be so good if we would have such disciplined trading on Nifty also. We heard that president is back from vacation. We can hope some words of exchange today.
Regards,
Praveen Kumar

Wednesday 26 December 2012

26 December 2012: Nifty Elliott wave analysis: Nifty came closer to 5838 zone again. Decisive push will result fall towards 5770. Technical almost remains unchanged. Stiff resistance will emerge ay 5900.


You must read previous articles and watch the given chart carefully to understand this article completely.
Today’s outlook: -


Global market is trading with silence in holiday season. While I am compiling this article, I have not seen anything positive on fiscal cliff in USA. It was impact of US market that even Nifty closed with some softness in the last trading session. Now we are just a day away from derivative expiry of December month contracts. If we do not go lower then market will be volatile in small range.
Trading ranges are already shifting lower from past two trading weeks. I am already mentioning the negative divergence on technical indicator MACD. Most important is that our market is almost remains unchanged for December month. We have hardly moved by 100 points. All this has happened when FII pushed more than 12k crs in cash market. It is not small sum of buying but indices are not lifting yet.
At the beginning of the month fund flow was positive indicator but now it is throwing concerns. Global money participation will be low due to Christmas vacation and this can increase volatility. An hourly chart has formed an H&S pattern with length of the head as 100 points of Nifty. I said many times that one should keep an eye on 5838 levels.
There is still a big question. Will this market move? I am afraid that till now it is trading on support but not giving anything great to break trend. It seems that development over fiscal cliff will provide a trigger but market has already discounted many such triggers. We need to note that we are almost not going to get any positive news flow.


Conclusion Nifty: One must have an eye on 5838. If it trades below 5838 for just 5 minutes then we can see higher degree of fall. You can conclude that if we start trading below 5838 then this month expiry will end up on nervous note. Technical resistance will be at 5888 to 5900. I have quoted the importance of 5888 many times in past. If I need to make some approximation then I can conclude that break below 5838 should give 5823 to 5815. After a pause it can see further fall.
S&P 500 – It came at 1426 on closing basis. Technical charts are suggesting that break below 1418 will give a trigger for 1400 marks. I believe that breakdown has already occurred. It is the matter of time for break. Let us see if anything comes on fiscal cliff.
Regards,
Praveen Kumar

Monday 24 December 2012

24 December 2012: Nifty Elliott wave analysis: Nifty came closer to 5838 zone again. Decisive push will result fall towards 5770. Concerns remain alive over US Fiscal cliff.


You must read previous articles and watch the given chart carefully to understand this article completely.
Today’s outlook: -


Till now there is a no great development yet on US fiscal cliff issue. We are moving near to derivative expiry but we have not seen anything great yet on indices beyond 100 points of trades throughout the month. Important is that it is happening after massive FII flows which is more than 2.50 bullion USD. Global market is turning silent near to weak near holiday season.
Technical charts were already suggesting for no rise above 5967 but we are unable to see great technical trigger. It has saved every time. In my views, if Nifty starts sustaining below 5838 then we can be in position to believe for a move towards 5770 marks. As of now indices futures are suggesting that we may little higher. We need to remember that we have seen a gap down n Friday which might be treated as bear gap down. This gives me a sense that we may see massive resistance in the zone of 5888 to 5900.
In the current rally, best suited moving average is 20 days exponential moving average which is saved every time. We need to note that frequent test of support can not be good for rising market. I am expecting a choppy market. I am feeling that a close below 5838 will change the behavior of many medium term indicators. Even now it is visible on MACD and RSI, both are showing more weakness than actual indices.
To be honest I am lot concerned with the behavior of negative divergence on MACD. I am equally concerned over VIX chart. Remember that it was VIX chart which has indicated first that we may not see the highs which market was expecting. Then we got follow up signals from band Bollinger.
This type of formation can drag indices lower near to the top or you can say that it can trigger profit taking. These cannot be easily tradable levels. I have already said in the beginning of last week that this market may loose patience very soon. Have it already lost?


Conclusion Nifty: One must have an eye on 5838. If it trades below 5838 for just 5 minutes then we can see higher degree of fall. You can conclude that if we start trading below 5838 then this month expiry will end up on nervous note. Technical resistance will be at 5888 to 5900. I have quoted the importance of 5888 many times in past.


S&P 500 – I do not need to change my studies. There are senses that many traders would have stoploss at 1400 marks only. I am sensing that we will the levels of 1400 by this week only if we fail to get any solution over US fiscal cliff. I do not know how far I am correct but I am sensing that US policy makers are not willing to give any solution. So tax hike is coming for USA???
Regards,
Praveen Kumar

Friday 21 December 2012

21 December 2012: Nifty Elliott wave analysis: Do you know that Nifty open at 5915 for this month and it is still at 5916. Charts are suggesting that it may loose patience now any moment !!!


You must read previous articles and watch the given chart carefully to understand this article completely.


Today’s outlook: -
Before beginning, I am updating that right at 7 am, 21st December 2012 Dow Future is down by 201 points. So impact is definitely expected now in the opening minutes. Soft opening may give us opening below 5890 levels. US policymakers are making unnecessary delay. Can I say that global market starts loosing patience? People are going for Christmas vacation and fiscal cliff remains unsolved.
Another important point to note is that we have seen massive slide on Gold and Silver price last night.
Let us come back to the technical of Nifty and India market. Look at the behavior of MACD. It has created a sandwiched sell signal. You might be feeling that world is still stable but technical indicators are not yet comfortable. I have already discussed about negative divergence on MACD relative to the 5815 and 5956 top.
Even RSI is not as comfortable as past week. I still need to say that market need to sustain lower for the confirmation of fall. I must say that on higher side it cannot be easy to cross 5950 – 5965 levels. in the lower side, we may see weak opening that this may be ‘bear gap’ down. If that happens then we can see it sliding towards 5850 by today’s trading only.
We got too many things from winter session of parliament. Market has got almost all good news and it has not reacted yet for this month of trades. It seems that market has fulfilled its apatite. We have seen high in banking and metal stocks yesterday. So we can say that practically most stocks are still rising with higher high.
On Nifty we are almost 40 points away from high of 5965. if bounce back has to come then it can come on steel ad banking stocks. I am not betting anything.


Conclusion Nifty: I strongly believe that we may see this market loosing patience. Technical resistance will be at 5950 to 5967 levels. Technical support will be at 5880. Break below 5880 should give us 5850 levels. if it has sustain then it need to save 5880.
S&P 500 – I am still quoting that the bounce form 1345 should end near 1445. In order to move higher it need to close above 1445 for two days in a row. If condition satisfied then only we can think about the test or break of 1475. Today’s trading will be decisive. US market futures are heavily down.  
Regards,
Praveen Kumar

Thursday 20 December 2012

20 December 2012: Nifty Elliott wave analysis: Traditionally Nifty is again turning choppy. No great monthly change. As long as 5900 hold we can still expect rise. Market may loose patience very soon.


You must read previous articles and watch the given chart carefully to understand this article completely.


Today’s outlook: -
I have already said that this is ‘Paralysis of Analysis’. Look at what has happened yesterday. After a strong rebound on Tuesday, it just turns choppy when expectation was very high. It is giving all signs of tiredness but still not turning weak. Any indices or stocks cannot be termed as weak as long as those kept on standing near high.
I have experienced this in past also that longer choppy movement can cause some change in technical indicator’s behaviour. MACD has given sell few days back and not it is immediately trying to be on positive side. Over all things are like we are still standing near short term resistance. I am feeling that things will change a lot if we stand above 5967 levels, which I have already discussed in recent past. I still believe that I cannot ignore the development of possibility of negative divergence on MACD.  
We need to note that we have not corrected by more than 33% in the rally which has length from 5548 to 5965. There is an interesting fact that Nifty is respecting a lot to 20 days exponential moving average. If Nifty breaks 5900 then we can hope for correction.
Intraday dull trading is something which can be tougher to deal. Get ready to see the impact of Gujrat poll result. Some indication – BJP will win this election by getting only 100-110 seats. It is suggested by some sources. Any shock above 120 will give some good time. Personally I believe that BJP should get 125+. Congress is keeping eye on HP results. Stock Market will take it positive if BJP get stronger.


Conclusion Nifty: I strongly believe that we may see this market loosing patience. Technical resistance will be at 5950 to 5967 levels. Technical support will be at 5900 marks. I can be concerned for fall only if breaks 5900. Nifty December future can be weak only below 5924 levels. Will it break?
S&P 500 – I have already discussed above 1445 few days back also. It has failed to close above those levels for second session in a row. I believe that we can think about Santa Rally only if it managed to close above 1445. Now we may see S&P 500 correcting towards 1415 in coming 2-3 trading session. They are still failing to solve fiscal cliff. These policy makers’s are testing the patience of market.
Regards,
Praveen Kumar

Wednesday 19 December 2012

19 December 2012: Nifty Elliott wave analysis: Nifty has broken 5838 for few seconds and bounce back. It is tougher zone to deal but we may expect the re-test of 5959 to 5965 levels.


You must read previous articles and watch the given chart carefully to understand this article completely.


Today’s outlook: -
RBI kept all key rates unchanged. We have seen slip and then a strong rebound. Market is taking things on really optimistic way. It is concluding that no rate cut in December is a confirmation for big rate cut in January. Every time different set of influential people came to pressurize RBI and Stock market moves in that way. Banking amendment bill and company bill has passed in parliament. Land bill and insurance will has deferred to Budget session.
So far charts do not understand the reason it only gives the direction. It is showing that as we are saving support of 5838 to 5820 then we need to see the bounce. I can say that we may see the speculative rise again.
FII – net buy INR 922.37 crs, DII – net sell INR 491.12 crs.
Technical indicators are fluctuating and we need to give higher priority to the trading pattern. So as long as this market holds above 5888 after a gap up this market will try to inch higher. I need to say that this market is discounting many good news so reactions may not be very big. Do take a note that now companies have to spend 2% on CSR. So far I can say that these steps are good for long term.
We need to watch the development on technical indicators. In two words I can say that this is the phase of ‘Paralysis of Analysis’. Market may not move parallel with technical indicators. The good way to trade is to give higher priority to the fast moving indicators on small time frame. We are still trading near to the monthly opening only. Movement are little higher or lower from 5900 marks but no decisive move is coming yet.
We have sell on MACD and we have negative divergence too.


Conclusion Nifty: It has given a fall after RBI policy but rebounded strongly on January hope. For today, as long as 5880 hold we can expect a move towards 5950 to 5965 levels. Only a cross above 5967 can give us a sense to talk about higher levels like 6000. To be honest, there is no idea how long can this market extend. Surprises may come at higher levels.
S&P 500 – It came at 1445 on the hope of some positive development on fiscal cliff. Problem or no problem, S&P 500 rebounded by 100 points from its low. If it sustain above 1445 (which is likely now, if we close above 1445 for today also) then expect a move towards 1470. I am still giving higher importance to 1475 but analysis needs to be on fair side. Can we hit 1500 on S&P? Looking like nothing is impossible.  
Regards,
Praveen Kumar

Tuesday 18 December 2012

18 December 2012: Nifty Elliott wave analysis: Nifty is still saving 5838. It does not matter what will be the outcome of RBI monetary policy, charts are suggesting for post hour fall. Still a question – will it break 5838?


You must read previous articles and watch the given chart carefully to understand this article completely.


Today’s outlook: -
Nifty has saved 5838 again and it kept on trading in an extremely narrow trading band. I can sense that it was hope of rate cut which was saving this market. There are some signs of tiredness. Now, market seems to be moving only after RBI’s monetary policy review.
Fair expectation is – 25 basic point CRR cut. Repo rate – remains unchanged.
Wave charts are suggesting that this is a phase of consolidation. We can see this market consolidating for few more days. I need to add that as long a 5838 saves we cannot say for anything good on profit taking. There is some crucial development on technical indicators. MACD has given a sell signal, which I kept on discussing from past few trading sessions.
This is a critical phase after a sharp rally from 5548 marks. One by one, many indicators has given sell signal but those put only a pause in the market. Unless we drift below 5838-5815 zones we cannot say that profit taking is acceptable.
Alter views suggest that if it kept on saving 5838 (which not a likely situation) then we can see another wave extension. In my view, globe may enjoy Santa rally but Indian market might be laggard if market takes RBI policy as disappointment. (Note that I am saying about the way market takes, market must be focusing on wording too. Sometime even no rate cut were able to bring cheer and sometime even rate cut can disappoint. This is not a time for guess work).
I like to draw your attention towards one more factor. Government is supposed to present land bill and pension bill in the parliament today. We need to see the hue and cry over ‘reservation bill’. SP has decided to take its action in Lok sabha. I need to say that UPA is taking the benefit of tussle between two regional parties. With every single bill, this government is loosing one partner. I am not raising any question marks on government stability but this is not a good trend and political uncertainty next year.


Conclusion Nifty: It is saving 5838 yet. I am still saying that near to 5850, it is better to wait for the break of 5838 for better confirmation. Technical resistance will at 5888 < 5912. Suppose if it breaks 5838 then only it can open scope of 5770 which I have indicated few days back. Nifty December future has also saved 5880 with a margin of one point. It has happened as premium was reducing yesterday. Charts are still suggesting for likely fall in index if and only if levels break. If not, then another dull day.
S&P 500 – It seems that S&P 500 may give a Santa Rally on year end with hope of some positive solution coming about fiscal cliff. From a point of 1432, it will have stiff technical resistance at 1445. In my view, US policy maker are making unnecessary delay in solving a problem. We will get more clear picture tonight.
Regards,
Praveen Kumar

Monday 17 December 2012

17 December 2012: Nifty Elliott wave analysis: Nifty took support at 5838 but over all trends is still critical. Hope of rate cut is dominating to save market. It may break 5838 and fall toward 5770.


You must read previous articles and watch the given chart carefully to understand this article completely.


Today’s outlook: -
Nifty has a typical bounce on last Friday in last one hour of trades. It has tried to push the market to close on optimistic note but things are still not changing. I am giving all importance to 5838 as crucial support now. If it manages to sustain below 5838 then definitely we will see levels of 5770-5754 marks.
We need to note two things. First is that this market is strongly hoping for ‘rate cut’ after IIP and WPI data. This market has already shown enough patience. If things remains he way like this then we can see this market loosing patience.
There is another important development on political front. Tussle begins over ‘promotion in reservation’ bill. Market would like to see the result of voting in Rajya Sabh. I am tired of seeing those all odd comments coming front politician. You all know what I am talking about.
On Friday, FII bought INR 574.38 crs and DII sold INR 512.43 crs in cash market. I have already said in past also that you need to study derivative also to conclude something. This kind of fund is just information and should not be used for conclusion. FII are trying to be bullish but they are not very confident.
Technical charts can be divided in to three parts to understand it.
First is Nifty daily chart. It is still showing that any rise will have tougher resistance above 5900 marks. It is trying save but there is enough doubt for revival at current levels. As long as we are staying below 5900-5912, we cannot see anything remarkable on positive side. Technical indicators like Parabolic SAR, Band Bollinger is still hinting for some weakness.
I have already said that MACD is very close to give a sell signal. If this happens then it will be negative divergence and this cannot be good sign to buy or any extension in gain. It can be ‘rate cut’ hope which is reflecting on RSI but it still not good enough to conclude. Market is expecting at least 25 basis point CRR cut.

Few days also, I have quoted that VIX is not at a comfortable whenever we hit newer high. Value of VIX should be down at each top formation compare to the previous one. It is happening in reverse manner. Lows are trying to higher with every top.


Conclusion Nifty: On Friday I said that I like to see trades below 5838 but it never goes below that mark. Low was just 5839. I am again advising to focus on 5838. Trades below 5838 will give a better confirmation for fall. As long as it is staying above 5838 it will test best of your patience. On higher side 5900-5912 will act as stiff resistance. Be ready for surprises this week. There is a high chance that market will loose patience this week. Nifty December Future is (based on 15 minutes intraday chart) suggesting that we cannot opt to trade long unless it stand above 5934 levels. you can look at the chart to understand reason.
S&P 500 – Dip came even on Friday. We are on decisive mode now. As of now also, I am expecting levels of 1400 to 1385 to come before a Santa Rally. For today’s session, 1408 will be critical support but fall need to come.
Regards,
Praveen Kumar

Sunday 16 December 2012

17 December to 21 December 2012: Wave Analysis: Pullback came from higher levels but not enough signs of anything remarkable. 5967 to 5838 will be decisive. Rise may get sold at higher levels.


You must read previous articles and watch above chart carefully to understand this article completely.


This week outlook: -
I have mentioned resistance based on Band Bollinger last week which was at 5967. It hit a top near to than then we have seen one profit taking which continues till 5839. These were intraday pullback and then rise. Weekly charts are still not very convincing for 6000 marks yet?
Many market men are feeling that we will get 6000 or 6100 or may be a newer high to. Even I also used to think in that ways. Most bitter truth of this market is that it forces you to think in that way always near to some top formation. I need to that many technical indicators are turning sluggish. You can yourself try to conclude looking those technical indicators. It is also a noticeable fact that our market has never slipped for two weeks in a row from last 21 weeks.
We have RBI’s monetary policy review. Market is still hoping for rate cut. I feel that market is expecting at 25 basic points CRR cut. To be honest, I do not think that it is coming but I cannot deny such situations.
If you are bullish then I am sure that you are betting on rate cut. It is also true that if Nifty has to hit 6000 then rate cut might be trigger points. In my view, it is not a meaningful approach for 25 basic points CRR cut. Market and economy needs repo rate cut.
One think that I am already suggesting from past many weeks, you may like it or you may not like it but you cannot ignore it. Politics is still at a point which can disturb market. A tussle coming over ‘reservation in promotion’ bill, it is a fully expected step. Let us see how government handles their ‘M square’ factors.
Conclusion Nifty – Charts are suggesting for a technical resistance at 5967 levels and support at 5838 levels. This may be applicable for first half. I am feeling that we will get a decisive view by this week itself. It is not a short after pullback. As long as 5838 holds then I can prefer only higher levels to short. Break below 5838 will give us 5770- to 5754.
S&P 500 – Pull back has not came the way I was expecting. I am still sure that S&P 500 will come in the zone of 1385 to 1400. Then, it might try to prepare for Santa rally.  Will it cross 1475 in recovery? We need for the time to answer.
Regards,
Praveen Kumar

Saturday 15 December 2012

VieCapital - Free calls for Observation


I am not a very firm believer of trials. It is not possible to explain anything in one-two days. As people are wanting it most of the time so we are opening ‘Observation calls’ for one day or minimum of two calls. Use these calls for observation, not for trading. firstly, you should be confident before making deals. 

To get free call you need to send us SMS at 9893369889 or mail at praveen@viecapital.com

We are dealing in most active stocks. One must have sufficient capital flow for trading account. We do not give any guarantee for success of calls. It is fully dependent on market conditions. We deal in technical analysis and traders must understand the risk part of trading. Many traders are opting margin trading. It is strongly recommended that you should try to avoid 'margin trading' as far as possible. 
  •  Minimum capital availability for Equity segment is INR 3 to 5 Lakhs
  •  (SMS 'TRIAL EQ' to 09893369889)
  • Minimum capital availability for Derivative segment is INR 7 to 10 Lakhs.
  • (SMS 'TRIAL DER' to 09893369889)
  • Minimum capital availability for Nifty Future segment is INR 1 to 2 Lakhs.
  • (SMS 'TRIAL NF' to 09893369889)


We are always available on yahoo messenger during trading hours on id – talk2praveen2002@yahoo.co.in

Subscribers can contact Praveen Kumar during trading hours in cash of any difficulty or one can contact post 4 pm to get guidance for trading. Prefer to talk to Praveen Kumar before taking trials too. You can send mail or SMS too as mentioned above. 
Please mention your Name, mail id, mobile number, city (currently living or prefer to send address) and your money availability.
Regards,
Vie Capital 

Thursday 13 December 2012

14 December 2012: Nifty Elliott wave analysis: Day after day, technical charts are confirming for a pull back. So far, target is looking like to hit 5770 to 5757 levels. Shall I buy lows?


You must read previous articles and watch the given chart carefully to understand this article completely.


Today’s outlook: -
Nifty has suddenly broken yesterday to close at 5851 levels. I have already indicated in recent days that break below 5890-5888 will dive it towards 5854 to 5817 levels. I am feeling that we are moving towards those targets or supports.
One thing, if downside is the direction then, breach of one support will open scope for the next. So, it is not a good idea to predict a bottom so I am using some approximations from Fibonacci series and counts to get some idea for my short deals.
Yesterday FII bought INR 1256.57 crs and DII sold INR 665.67 crs in cash market. I have already said in past also that you need to study derivative also to conclude something. This kind of fund is just information and should not be used for conclusion. FII are trying to be bullish but they are not very confident.
I hear that government has passed land acquisition bill yesterday. Is it going to give some positive impression? Of course yes but unfortunately our market seems to be discounting that positive news. After a limit, technical indicators start dictating. Do take a note that every single step by government may be overlapped by ‘reservation in promotion’ bill. Market was assuming few weeks back only that it was a done deal. Cabinet has cleared the bill but few state governments might object on it. You can hate politics but you cannot ignore. People will surely name newer land bill as anti-farmer. It will be a newer set of drama so market should not over react.
Have a look on the given chart. Sell signal came from another technical indicator. It is parabolic SAR. This indicator is giving sell after real long time. So, shall we give up for 6000? In my view, a pull back was needed and it is coming. After the end of fall I can be in the better position to say. Right now, I am on short side. MACD has not yet given sell signal yet but very close to give. If this sell signal comes then it will be negative divergence.

Conclusion Nifty: So far it is moving the way we have predicted. We have seen a high at 5965 while I gave a range of 5950 to 5967 as resistance. Now I am targeting Nifty for 5770 to 5757 levels. Why 5757? You need to note that 50% from 5548 against the rise of 5548 to 5965 will be at 5757 levels. I am saying that half of the rise should be washed out. It has definitely tested my patience on short side.I like to see trades below 5838 for intraday.

S&P 500 – I said yesterday that keep stop loss at 1445 and turn short. I took some short position day before yesterday above 1430 (some asked me what’s the use of S&P 500? Please not that S&P 500 future is trading at NSE). My first technical target will be at 1400 and then at 1385. If you remember, it was given in our weekly study too. It does not matter what Mr. Ben Bernanke is saying. Please solve fiscal cliff as soon as possible. Do not give a chance to the market to speculate.    
Regards,
Praveen Kumar

Wednesday 12 December 2012

13 December 2012: Nifty Elliott wave analysis: Nifty kept on trading in a range but it is likely to see a fall. It will fall towards 5817 to 5770. Every rise will have stiff resistance in the zone of 5910 to 5965.


You must read previous articles and watch the given chart carefully to understand this article completely.


Today’s outlook: -
Nifty closed on dot at mentioned crucial levels of 5888. It has slipped again from higher levels and giving a hint for this profit taking to go deeper. Technical charts are still suggesting that we may try to go lower. I have already mentioned in my past studies that it may test 5854 and then 5817 at the break below 5890. Condition has fulfilled but movement is still dull.
FII has bought INR 952.75 crs and DII sold INR 365.60 crs.
Look at another important event. October months IIP data is more than 8%. Is it sufficient to say for rise? We need to remember that it has lower base effect and October was a festival month. I can still say that those data is a much better data (if there will not be revision later). If IIP were good then we have another poor inflation data where market got CPI just shy at 10%.
It is not fair to assume for rate cut now in the month of December. I am still thinking to buy the dips but now I will prefer to take fresh decision after seeing the magnitude of dip. Technical indicators like MACD are looking troubling. It is giving a possible negative divergence. I doubt if we can hit 6000 market very soon.
In another important event, I cannot ignore political situations now. Our economy wants better and deserves attention but politicians are busy for some discussions which might create further dead lock in parliament. I am talking about ‘reservation in promotion’ bill. In my views, I am still not convinced that current government may fail to march ahead with reforms.
Our market may not follow global strength. Technical shapes are not very encouraging.
Conclusion Nifty: I need to adjust some levels but views need to be same. I will consider 5930 < 5950 and 5967 as crucial resistances. Every 20 points rise will face stiff resistance. I am assuming for towards 5854 and then 5817 levels. It will be a better idea to keep selling on rise. It is very logical to expect price correction after 400 points of rise. I do not think that I need to change my views in 8-10 points.
S&P 500 – It has extended to hit almost 1435. It is a full 90 points of swing for S&P 500. I need to say that cross over of 1424 is giving a mild buy but will create a top which will sold very soon. It can happen anytime now. Take a note that we may re test 200 days moving average which is at 1385. One can prefer to keep stop loss above 1445.
Regards,
Praveen Kumar