Friday, 31 October 2014

31 October 2014: Nifty Elliott wave analysis: We will see another life time high. Higher levels demand caution. A top can emerge in the zone of 8210 to 8240, based on wave theory. BANK NIFTY must be first to slide.

You must read previous articles and watch the given chart carefully to understand this article completely.
For 31 October 2014: -

On 30 October 2014, FII Bought INR 1257.49 crs and DII Sold INR 94.01 crs
Expiry goes on highest point for Nifty. I was expecting pullback from high with a sense of double top. Due to global strength we may not able to see immediate pullback. Well, big question is what wave theory is telling us. Every rise is not bullish based on wave theory and we are on one such level. We are at all-time high. Technical analysis will say that now there is no resistance. In reality, in cases optimism used to kill bulls.
I am not short on Nifty future yet but I am expecting weakness in bank Nifty.
For today’s trading session, opening above 8182 will give us levels in the zone of 8210 to 8240. Whatever be the top we may see a meaningful drag from higher levels. Hence, one has to be very cautious at higher levels. Today is the last trading day of the week and month as well. Technology stocks have added strength.
Please visit our ‘intraday updates’ to get further updates or to take good advantage join paid services.
Strategy for Nifty November future – We may see opening above 8200 as suggested by SGX Nifty. This may be due to global strength. Even after all-time high I must add that traders have to be very cautious at higher levels. Where is resistance? It may come in the range of 8260 to 8300. It is not easily predictable at all-time high. Please refer to intraday updates too.

S&P 500 (USA) – We have seen a high coming near to 2000 but not crossed. My condition for idea short is still on but it seems that I need to have wider stop loss. I still believe that we are almost running near to another short term top. If it is not the top then also buy can be applicable above 2020. We may have scope for 2050+ if it manages to cross above 2020. Rising wave pattern is applicable only above 2020. 

Thursday, 30 October 2014

30 October 2014: Stock Chart Analysis for intraday – TATASTEEL, ONGC and BANKBARODA

TATASTEEL (471.70)
Buy above 474/SL 471/ Target 480|| Sell below 468/ SL 471/ Target 462-460

ONGC (392.80)
Buy above 396/SL 394/Target 400-402||Sell below 389/ SL 391/ Target 385-380

BANKBARODA (906.30)

Buy above 913/ SL 909/ Target 919||Sell below 899/ SL 903/ Target 890-880

30 October 2014: Nifty Elliott wave analysis: Here is derivative expiry. Above 8100, it may challenge previous all-time high. Failure @ high can cause impulsive selling. Be cautious at higher levels.

You must read previous articles and watch the given chart carefully to understand this article completely.
For 30 October 2014: -

On 29 October 2014, FII Bought INR 785.61 crs and DII Sold INR 507.29 crs
Technical target above 8032 was at 8100 level which was almost done. It may trade here and there again at 8100 today. We have derivative expiry for October month trade. I am advising caution at higher levels. Take a note that Bank Nifty is missing strength at higher levels although it was a better performer in past few days of trade.
Expiry day is my least preferred day for trading. If you cannot afford the odd volatility then it will be better to take a leave. Based on technical chart, if Nifty can sustain above 8100 then we can see it challenging level near all-time high too. There is no concrete sign of shorting yet.
For today’s trading session, we may see flat opening. Due to so many holidays in past few days and subsequent gap up, we have not able to trade many levels. Technically, we are entering resistance zone now. Technical support is at 8040 to 8030 zone.
Please visit our ‘intraday updates’ to get further updates or to take good advantage join paid services.
Strategy for Nifty November future – We may see flat opening. After opening, 8160 will act as resistance while support can be expected on levels near 8100. Fluctuation from 8100 to 8160 will just make you tempted. Shall I buy? May ne not. I may opt to be bear on any impulsive high. Only condition is that Nifty spot should not stay above 8100. Impact of Nifty spot above 8100 can be a short covering.

S&P 500 (USA) – yesterday, it took a high at 1991 and then slipped to hit 1970 before bounce in final hour. Now, I say that it is almost a good level to add short here with stop loss above 2000 levels. Take a note that this may be the first correction only after hitting 1805 odd levels few days back. My first test point as shorting will be at 1956 support area. 

Wednesday, 29 October 2014

29 October 2014: Stock Chart Analysis for intraday – SBIN, RANBAXY and RELINFRA

SBIN (2656.75)
Buy above 2665/SL 2655/ Target 2700|| Sell below 2640/ SL 2652/ Target 2610-2600

RANBAXY (633.75)
Buy above 640/SL 636/Target 648-652||Sell below 629/ SL 633/ Target 628-624

RELINFRA (575.25)

Buy above 580/ SL 576/ Target 590||Sell below 569/ SL 573/ Target 562-555

29 October 2014: Nifty Elliott wave analysis: Above 8032, it is generating target of 8066 to 8100 levels. Strong technical support will come at 8000-7990 levels. Do not be aggressive now at higher levels.

You must read previous articles and watch the given chart carefully to understand this article completely.
For 29 October 2014: -

On 28 October 2014, FII Sold INR 108.00 crs and DII Sold INR 99.66 crs
Nifty has played hide and seek at 8032 levels. We saw good rise in US market last night. This may thrust for some higher opening. It is suggesting for a test at 8066. This is key level. If it is able to sustain above 8066 then we can expect a test of 8100 levels too.
Indian market looks tired against strong strength in global indices. This may be the effect of derivative expiry next week. Technical charts are suggesting that if some top has to form before fall then it can come either by today or by tomorrow. When I am saying this then I have to be fair. I cannot rule out the possibility of new all-time high as long as we are above 8000 Nifty. So just do not be in hurry for shorting index.
For today’s trading session, we will see another gap up. After gap up if it stays above 8066 then we may expect levels above 8100 too. I just do not think that we can see able to see market going higher than 8100 before expiry tomorrow. Technical support after gap up will come at 8040 and then at 7990.
Please visit our ‘intraday updates’ to get further updates or to take good advantage join paid services.
Strategy for Nifty October future – I was long yesterday and gave up in last few minutes. Here it comes with another gap up. Majority of rise from 7750 has wasted in this odd gap up. Well, rise may be limited of it opens in the range of 8080 levels. I just suggest, do not trade before expiry. It may be wild now.

S&P 500 (USA) – So far, long trades goes great. In fact it’s better than any emerging market. It has not only crossed above 1874 but also manages to close above 1684. This is again showing that some steam may present in the market. Can it again test 2000? 101%, I was not considering this figure when I gave long call from the dip below 1850. As of now, I will consider a small possibility of 2000 before FOMC. I am not in short and there is no such plan. 

Tuesday, 28 October 2014

28 October 2014: Nifty Elliott wave analysis: NIFTY may go on pause before derivative expiry now. Technical resistance = 8032-8066 and technical support = 7950 !!!

You must read previous articles and watch the given chart carefully to understand this article completely.
For 28 October 2014: -

On 27 October 2014, FII Bought INR 49.14 crs and DII Bought INR 9.55 crs
If I exclude first five minutes of impulsive trades then we hardly got anything above 8032 on Nifty. High point of 8064 was also on 78.20% resistance mark of wave ‘c’ as quoted. We saw closing goes on lowest point of the day. This is first hint of pause emerging here. Take a note that we have derivative expiry for October month of trade.
We should try to find out the next possible move from 8000 levels. It is favouring for a possible dip now. Now support, if it form a level of lower low again today then it may push a confirmation to us. I believe that 7950 to 7925 may offer support in dip. On higher side, 8032 and 8066 may act as stiff resistance point in any rise.
For today’s trading session, we have a chance of seeing a consolidation which may be the part of global trend. A short signal for trading may come once it breaks 7990. We may see level of 7950 as support. We may not have good trading range today if it does not give up form high.  
Please visit our ‘intraday updates’ to get further updates or to take good advantage join paid services.
Strategy for Nifty October future – We can expect technical support at 7990. Once it breaks and sustain below 7990 then only we can expect some profit taking after this 300 points of rebound. Do not prefer to trade positive zone for few days. We are on derivative expiry week and cautious is advised at these levels. Somehow we may not move much from current levels in hurry.

S&P 500 (USA) – When I said silence in trade for few days, then also I believe for a test or a level near to 1974. Well, it may not be condition with compulsion. I must be clear that there is nothing that I can say for shorting S&P immediately. I will prefer to wait for such signal. Recovery was too sharp and hence it may go under some time consolidation. Once, I get signal for price consolidation then only I will act on it. Critical support point is too far, i.e. 1932. 

28 October 2014: Stock Chart Analysis for intraday – RCOM, TATAMOTORS and ACC

RCOM (99.50)
Buy above 102/SL 101/ Target 104-105|| Sell below 99/ SL 100/ Target 98-96

TATAMOTORS (503.70)
Buy above 509/SL 505/Target 515-520||Sell below 499/ SL 503/ Target 490

ACC (1460.10)

Buy above 1485/ SL 1475/ Target 1500-1510||Sell below 1455/ SL 1465/ Target 1430

Monday, 27 October 2014

27 October 2014: Stock Chart Analysis for intraday – KTKBANK, BHEL and DRREDDY

KTKBANK (118.90)
Buy above 120/SL 119/ Target 123-125|| Sell below 117/ SL 119/ Target 115-113

BHEL (240.40)
Buy above 244/SL 242/Target 250||Sell below 238/ SL 240/ Target 235-232

DRREDDY (3057.65)
Buy above 3070/ SL 3055/ Target 3100||Sell below 3040/ SL 3055/ Target 3000

27 October 2014: Nifty Elliott wave analysis: NIFTY may take a test of 8080-8100 levels if it manages to stay above 8032 levels. Technical support = 7990 and 7950.

You must read previous articles and watch the given chart carefully to understand this article completely.
For 27 October 2014: -

On 22 October 2014, FII Bought INR 7.54 crs and DII Bought INR 375.55 crs
Finally, it goes above 8000 marks on Diwali day. It has given a fresh hope to bulls. This rise has justified by charts and technical indicators too. It has broken a pattern of three waves down and something interesting must be coming.
Elliott minute wave ‘c’ emerges at 7730-7720 levels and now we have a good chance of hitting a higher wave. Well, now we are in a situation where we may see a possibility of challenging all-time high. In a clear cut wave sense, if nifty stand above 8032 then we may see a possibility for 8180 + levels by this week itself. As long as it is above 7950-7925 levels, we should not be worried much.
For today’s trading session, we will see technical support at 7980-7990 levels itself. As this run up is already by 300 points so we may see some choppy activity too before taking fresh move. In may make Nifty less interesting for some time. If it able to sustain above 8032 then we may see a possibility of 8080 levels.
Please visit our ‘intraday updates’ to get further updates or to take good advantage join paid services.
Strategy for Nifty October future – Most good trades are spoiled by gap up. If it comes with gap up of 30-40 points again then we may miss another opportunity for intraday. Logically, it is developing a target of 8080 if it manages to stand above 8040 levels. Technical support remains at 8000 levels. I avoided traded due to long weekend.

S&P 500 (USA) – I was expecting a range of 1960 to 1974 from past week itself. We got this range but there is no sign of any pullback yet. I believe that 1974 may offer some resistance. Now, suppose if it turn choppy here before fresh move then one must not act. Remember, 1965 came in straight line after breaking threshold of 1908. Things are fast and furious hence it is developing a condition of silence. 

NIFTY weekly analysis for 27 October’14 to 31 October’14


Elliott wave theory: Weekly wave pattern has added strength now. 38.20% retrenchment support comes at 7774 and weekly closing is almost on dot. It may invite consolidation. I issued a call not to short from 7750 itself. It may extend comparable to new high or 8100. Out of 300 points rebound, most came as gap up. This is only part to be worried. Given marking will change for wave if it extends above 8181.
Market cycle: we can expect some higher levels this week. Technical support for this week will come at 7950 to 7925 levels.
Technical indicators: I am less worried about technical indicators now.  It comes to zone where consolidation is good and most expected. This consolidation will give buy from low.

Charting pattern: As expected from last week itself, we got 8000 + levels on Nifty. Now we are on expiry week and we may see some hectic activity but things should lastly favour bulls only. 

Thursday, 23 October 2014

Wishing you and your family a very happy Diwali - Vie Capital and Praveen Kumar

From Diwali 2013 to Dilwai 2014 : Last year recommendations were - 

1. Auro Pharma - from 240 to 1002 as high
2. Sintex - from 30 to 105 as high
3. SesaGoa (SSLT) - from 200 to 320 as high
We will make some bet for this year too for investment calls !!!

Wednesday, 22 October 2014

22 October 2014: Stock Chart Analysis for intraday – TATA MOTORS, SAIL and AXISBANK

TATAMOTORS (501.45)
Buy above 503/SL 500/ Target 510-514|| Sell below 496/ SL 499/ Target 490

SAIL (82.40)
Buy above 82.55/SL 81.75/Target 84-85||Sell below 81/ SL 81.90/ Target 80-79

AXISBANK (423.05)

Buy above 424/ SL 421/ Target 428-432||Sell below 418/ SL 421/ Target 412

22 October 2014: Nifty Elliott wave analysis: NIFTY may hit 8000 marks by today and it is looking all good before Diwali. There is no sign of weakness so far at higher levels. Support after gap up = 7970-7950 !!!

You must read previous articles and watch the given chart carefully to understand this article completely.
For 22 October 2014: -

On 21 October 2014, FII Bought INR 32.40 crs and DII Bought INR 68.94 crs
A bounce came from 7723. I have already quoted for a move towards 8000 levels since lower levels itself. It seems that we will see levels near 8000 by today itself and a good rise tomorrow during Muhurat trading. I have strongly quoted for ‘not shorting’. Hope you are not short. Things are not so simple. Most of the rise came in gap up formation. This is not good for market health.  
Elliott minute wave ‘c’ emerges at 7730-7720 levels and now we have a good chance of hitting a higher wave. This rise can extend up to 7950-8000 levels. I hope that it will maintain support at 7850 to 7825 and then it can take a final move. I am hoping for optimism on Diwali day which can give 8000 levels too.
For today’s trading session, we will see a much stronger gap up. This will come due to massive rise in US market. If you remember, Indian market had shown relative strength when it was falling. Technical charts are suggesting that if it stays above 7940-7950 then 8000 must come on card. Now if it goes in gap up then hardly anything will come for intraday traders.
Please visit our ‘intraday updates’ to get further updates or to take good advantage join paid services.
Strategy for Nifty October future – Opening seems to come in the range of 8020 as it is indicated by SGX Nifty. Technically as long as it is above 8000 levels, never ever try to short. I have already warned traders from shorting from lower levels. Reasons are very clear now. My worry point is only one, i.e. gap up. Else, everything looks fine before Diwali.

S&P 500 (USA) – I have said for 1925 above 1908. It has not only crossed above 1925 but also manages to close above 1940. I have said for good bounce when it was trading below 1850 levels. Well, I was not so sure for this kind of quick 100 points bounce but bulls are so powerful. Now, this has come for consolidation. Moving forward it will face resistance at 1960 to 1974 levels. I must be clear, so far there is no sign for shorting. 

Tuesday, 21 October 2014

21 October 2014: Stock Chart Analysis for intraday – TCS, AXIS BANK and AURO PHARMA

TCS (2423.30)
Buy above 2432/SL 2420/ Target 2455-2460|| Sell below 2415/ SL 2424/ Target 2390-2380

AXIS BANK (417.85)
Buy above 420/SL 417/Target 424-430||Sell below 413/ SL 416/ Target 408-405

AUROPHARMA (933.75)
Buy above 940/ SL 932/ Target 960-970||Sell below 924/ SL 932/ Target 910-900


21 October 2014: Nifty Elliott wave analysis: We can expect consolidation and smaller trading range. I suggest trading less in these days. Support for NIFTY – 7850-7825 !!!

You must read previous articles and watch the given chart carefully to understand this article completely.
For 21 October 2014: -

On 20 October 2014, FII Bought INR 1040.08 crs and DII Bought INR 166.11 crs
It was just a gap up then turned dead. Market men go on Holiday mood. We have derivative expiry next week. After testing 100 DMA, Nifty is showing relative strength which was already suggested few days back too. I am expecting this rise to extend more. Key support is at 7850 to 7825 levels. If I have to be worried then I should be worry about trading range which may be smaller compared to past few days.
Elliott minute wave ‘c’ emerges at 7730-7720 levels and now we have a good chance of hitting a higher wave. This rise can extend up to 7950-8000 levels. I hope that it will maintain support at 7850 to 7825 and then it can take a final move. I am hoping for optimism on Diwali day which can give 8000 levels too.
For today’s trading session, I am expecting a flat opening. Immediate support will emerge at 7850. On higher side, we may expect levels of 7925 levels. It may try to generate momentum beyond the range of 7850 to 7925. Let us see when it breaks.
Please visit our ‘intraday updates’ to get further updates or to take good advantage join paid services.
Strategy for Nifty October future – Opening may come in the range of 7900 and then we may see some long dead hours. Immediate technical support is at 7880 to 7870 levels. I am waiting for some gap fill which came yesterday morning. We may have limited opportunity to trade long hence it must come from lower levels. If not then it will be better to ignore.

S&P 500 (USA) – I have said for 1908 yesterday and here it comes so close. It is great index. Technically if it manages to close above 1908 then we may expect levels of 1925 too. Here is some caution. Recovery goes almost on straight line so if it have to change a direction, this is the levels. Above 1908, it will deny moves for bears. If it fail at 1908 then we may see fresh wave for weakness. 

Monday, 20 October 2014

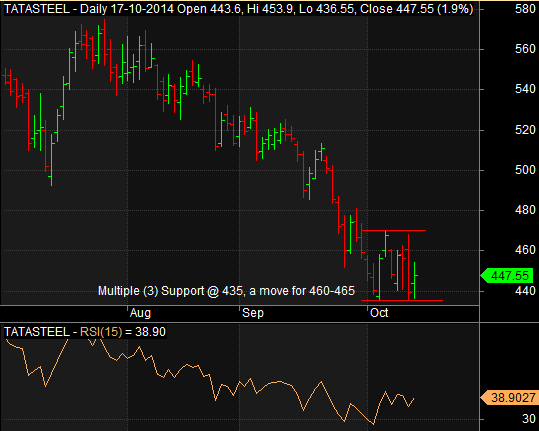
20 October 2014: Stock Chart Analysis for intraday – YES BANK, TATA STEEL and INFY

YES BANK (598.30)
Buy above 600/SL 596/ Target 612-620|| Sell below 594/ SL 598/ Target 586


TATA STEEL (447.55)
Buy above 454/SL 451/Target 465-470||Sell below 442/ SL 445/ Target 435


INFY (3851.65)
Buy above 3860/ SL 3840/ Target 3900-3920||Sell below 3800/ SL 3815/ Target 3760


20 October 2014: Nifty Elliott wave analysis: 100 DMA support and new MODI wave can give fresh air to this market. Do not add fresh long if it goes for wild gap up as shown by SGX Nifty.

You must read previous articles and watch the given chart carefully to understand this article completely.
For 20 October 2014: -

On 17 October 2014, FII Sold INR 1430.03 crs and DII Bought INR 737.31 crs
This fall goes on halt near 100 DMA support and this is a good part for bulls. We unwind all shorts and goes long. Unfortunately we book our Nifty long on Friday itself after some sell off in final hour. Well, it is still better than having shorts.
Elliott minute wave ‘c’ emerges at 7730-7720 levels and now we have a good chance of hitting a higher wave. This rise can extend up to 7950-8000 levels. Disappointing thing is that we are going to see a wild gap up today which will eat a major long opportunity.
Can we gain strength before Diwali? There is no clear cut sign yet. Historically, Indian market used to be sluggish before Diwali. Most of the time, real decisive strength used to come after Diwali session which used to continue till last of December. If weakness comes after Diwali then also, it used to last longer. So probably, based on market cycle, we are in indecisive zone for short term. It is looking like for some upside before Diwali now.
For today’s trading session, I will just not trade if it goes opening as SGX Nifty is suggesting. 7900+ levels will just say to wait for a dip after higher opening. Immediate trading support after opening will come at 7825-7850 levels.
Please visit our ‘intraday updates’ to get further updates or to take good advantage join paid services.
Strategy for Nifty October future – I can just break my head as I unwind my long at 7820 on Friday’s trading session in panic sell off. SGX Nifty is hinting for opening in the range of 7950. If this comes true then we have nothing more to trade. Immediate support will come at 7900 levels.

S&P 500 (USA) – I have already predicted for bounce. Recent dip below 1850 has trapped many forced and tempted bears. Technical charts are suggesting for a target of 1908-1915 level. We will see support at 1875 levels as support. I will opt to buy in dip for coming few days. This week will favour either bulls or it may go at consolidation after recent dip. 

NIFTY weekly analysis for 20 October’14 to 24 October’14


Elliott wave theory: Weekly wave pattern is still weak but it is on support zone. 38.20% retrenchment support comes at 7774 and weekly closing is almost on dot. It may invite consolidation. I issued a buy from 7750-7760 zone itself.
Market cycle: We saw dip of six weeks in a row. Take a note that we are on Diwali week now. History suggests that market wants to maintain main trend near Diwali. Hence, buy dip. It is another short week with just three trading days.  
Technical indicators: I am less worried about technical indicators now.  It comes to zone where consolidation is good and most expected. This consolidation will give buy from low.

Charting pattern: As long as it is below 7850 we cannot say for pain to be over. I hope that it will break higher above 7850. I am expecting 7900-8000 by this on Nifty. 

Friday, 17 October 2014

17 October 2014: Stock Chart Analysis for intraday – YES BANK, TATA STEEL and IVRCLINFRA


YES BANK (588.60)
Buy above 590/SL 587/ Target 599-605|| Sell below 583/ SL 586/ Target 578-575


TATA STEEL (439.10)
Buy above 443/SL 440/Target 448-451||Sell below 435/ SL 438/ Target 248-424


IVRCLINFRA (14.60)
Buy xxxxxxx NEVER||Sell – saying from 20+ to exit from long. My target can be 9. Do not buy on hopes.


17 October 2014: Nifty Elliott wave analysis: 100 DMA for NIFTY is at 7737. A short term bottom may come sooner now either at 7700 or max at 7600 levels. Do not add fresh positional short from low.

You must read previous articles and watch the given chart carefully to understand this article completely.
For 17 October 2014: -

On 16 October 2014, FII Sold INR 1128.37 crs and DII Bought INR 664.45 crs
It was quite unnoticed that Nifty came at 100 DMA which is at 7737. So, question is that will it take a pause in fall. It’s important to note that Indian market has shown great resilience in past few days against the global sell off. Now, global sell off may see pause or recovery anytime.
Based on Elliott wave, we may be on 1.618 times support to form a base for trending wave ‘c’ which is downside in nature. It’s the prime reason that I am saying that a short term bottom may come at 7600 or at 7700 levels sooner. Well, it does not mean that we will see new high. When I am quoting this then also I worried based on weekly chart which has generated a target of 7600-7500. Does it mean that there will be a day of 100 point swing from low? It may be true. Today is last trading day of the week.
Can we gain strength before Diwali? There is no clear cut sign yet. Historically, Indian market used to be sluggish before Diwali. Most of the time, real decisive strength used to come after Diwali session which used to continue till last of December. If weakness comes after Diwali then also, it used to last longer. So probably, based on market cycle, we are in indecisive zone for short term.
For today’s trading session, 7800 to 7825 will act as resistance while 7730 to 7700 will act as support. Just prepare for another wild day but do not short from low. Do take a note that we have 100 DMA and Elliott wave support almost at same levels.
Please visit our ‘intraday updates’ to get further updates or to take good advantage join paid services.
Strategy for Nifty October future – Nifty October future may take some positive opening above 7800 levels as indicated by SGX Nifty. Technically, it will take support at 7780 to 7760 after opening. I am not very sure if we should believe initial quote as it has extended lower low on daily chart. This is still a bearish formation. I am just considering hope based on market cycle and some key Elliott wave support.

S&P 500 (USA) – I still believe that 1820 to 1800 must be a support to invite consolidation. I am not suggesting shorting from low at any cost. It may be a trap for weak bears.  Market flush out bears of 1850 very soon with small spike of rise. I am looking for 1900 as target and resistance as well. It may not be bad idea to stay away from US indices for the time being. 

Wednesday, 15 October 2014

16 October 2014: Stock Chart Analysis for intraday – HCLTECH, RELINFRA and BAJAJAUTO

HCLTECH (1723.00)
Buy above 1735/SL 1728/ Target 1753|| Sell below 1715/ SL 1725/ Target 1700-1690

RELINFRA (571.80)
Buy above 575/SL 572/Target 580-585||Sell below 566/ SL 570/ Target 555

BAJAJAUTO (2412.00)

Buy above 2415/SL 2405/Target 2430-2450||Sell below 2399/SL 2411/ Target 2480-2470

16 October 2014: Nifty Elliott wave analysis: Trend line support goes at 7800 levels while it is facing resistance at 50 DMA. Resilience against global fall will be effective above 7925-7940 levels.

You must read previous articles and watch the given chart carefully to understand this article completely.
For 16 October 2014: -

On 14 October 2014, FII Sold INR 694.67 crs and DII Bought INR 495.52 crs
Once again, Nifty took support at mentioned trend line. This move was completely against global cue. So far, Nifty is taking support and showing resilience against global sell off. On higher side, it is facing resistance near to 50 DMA. I still feel that Nifty is taking support and we are witnessing time consolidation in the range of trend line support and 50 DMA.
Historical charts are suggesting that we can expect strength only if it manages to stay above 7940 zones. Till that time, we may see sell off from higher levels. It is interesting to note that right now we are still in three wave dip pattern on Elliott wave. There are two important threshold points on three waves down (a-b-c). One point is 7928 and next is 7978. There may act reversal point i.e. from weakness to strength.
There is no great effect of global weakness. I may buy relative strength in Indian market. For today’s trading session also, we have support at 7825 to 7800 levels. On higher side meaningful resistance can emerge at Elliott wave threshold at 7928. Once again, do not opt to buy mid cap and small cap stocks.
Can we gain strength before Diwali? There is no clear cut sign yet. Historically, Indian market used to be sluggish before Diwali. Most of the time, real decisive strength used to come after Diwali session which used to continue till last of December. If weakness comes after Diwali then also, it used to last longer. So probably, based on market cycle, we are in indecisive zone for short term.
My warning is still ON. Below 7800 or close below 7840 will cost Nifty for a move towards 7600-7500, based on Nifty weekly Elliott wave chart.
Please visit our ‘intraday updates’ to get further updates or to take good advantage join paid services.

Strategy for Nifty October future – Nifty October future may take some positive opening. As long as it is staying above 7890 I am expecting levels of 7950-7960 levels at least. I am not denying the possibility of 8000 either. Do not short unless it go below 7890 or show weakness at higher levels. I am keeping study and levels exactly same as of yesterday.

S&P 500 (USA) – Oppss !!! What a last night S&P had. It hit a low at 1820 and then bounced. This happened due to wide gap in supports. This sell off was quite expected. If you remember, I have already said for high for 2014 when it was hitting 2011. Well, what is next is the big question. Technical charts are hinting for consolidation in time wise and in price wise too. Hence it may not take out 1820-1800 support in a hurry but who can predict European market. End of QE is acting as shocker and it can prove me wrong in the magnitude of correction. My basic is suggesting me not to bet on recovery unless we get at least on positive close. 

Tuesday, 14 October 2014

14 October 2014: Stock Chart Analysis for intraday – DLF, SAIL and INFY

DLF (146.90)
Buy above xxxxxxxxx|| Sell below 146/ SL 150/ Target 138-130-120

SAIL (75.95)
Buy above 76/SL 75.50/Target 77-78||Sell below 73/ SL 74/ Target 71-70

INFY (3942.55)
Buy above 3955/SL 3940/Target 4000-4050||Sell below 3915/SL 3930/ Target 3870

14 October 2014: Nifty Elliott wave analysis: Recovery from ~ 38.20% support can give Nifty a push towards 7940+ levels. Technical support will come at 7850-7860. DLF – just never invest in this stock anymore.

You must read previous articles and watch the given chart carefully to understand this article completely.
For 14 October 2014: -

On 13 October 2014, FII Sold INR 671.06 crs and DII Bought INR 566.83 crs
Yesterday we opted to buy Nifty future at 7835 and planned to hold. It was just a test of support at 7800 which has shown based on trend line in the chart. In the wave pattern also we are almost at 38% of wave of 5. Exact dot point is at 7774. We are in constant three wave dip on Elliott wave chart. It just mean for one rise between two falls.
Now, above 7850-7860, we can expect some levels in the range of 7925 to 7940 at least. Real test and real challenge will come at 7980. Trend remains three waves (a-b-c) down as long as it is staying below 7980 but I took long on support. I will just not prefer to buy the rise.
There is no great effect of global weakness. I bought relative strength in Indian market.
For today’s trading session, we may see opening on upside. Immediate technical resistance can emerge at 7910 and then at 7945 based on technical analysis. Technical support will come at 7860-7850 levels. Take a note that practically it has never sustained below 7800 levels. If index is a buy then it never mean that I can buy midcap or small cap index too. Keep your eye on DLF too. I strongly criticize SEBI for their incomplete and extremely delayed action on DLF promoters. Give me a single reason for why have they exempted promoters from financial penalty. Do not give me logic that it could have hurt retails investors more. Where were these watch-dog when we saw HFCL meltdown multi year ago. I am expecting series of law suits coming ahead on DLF. Sooner, it will just be a smaller name in their domain. I will update a wave chart study on DLF on this weekend. Never-never and never buy DLF now in any dip or rise, strength or weakness.
Please visit our ‘intraday updates’ to get further updates or to take good advantage join paid services.
Strategy for Nifty October future – Nifty October future may take some positive opening. As long as it is staying above 7890 I am expecting levels of 7950-7960 levels at least. I am not denying the possibility of 8000 either. Do not short unless it go below 7890 or show weakness at higher levels. As we have forwarded long so I will look for suitable levels for exit to be on side line.

S&P 500 (USA) – In just four weeks it goes at five months low. It took a move towards my expected 1850 levels. It has closed at 1874 in last trading session with single day loss of 1.65%. It is the end of QE effect in October months. Well, shorting from 2000 to 1875 is sufficient enough. Now, mild technical recovery is expected. I will not prefer shorting without technical recovery. Someway an somehow we will see 1800 levels too sooner or later. Bounce can go at least in the range of 1890-1900 levels 

Monday, 13 October 2014

13 October 2014: Stock Chart Analysis for intraday – TATAMOTORS, BHEL and DRREDDY

TATAMOTORS (492.70)
Buy above 498/ SL 495/ Target 505|| Sell below 488/ SL 493/ Target 480-475

TATASTEEL (448.05)
Buy above 454/SL 451/Target 458-460||Sell below 445/ SL 448/ Target 438-435

UNITECH (19.25)
Buy above XXXXXXXXXXXX||Sell /Medium to long term/ Target 16-14-9

13 October 2014: Nifty Elliott wave analysis: Once again, have an eye on 7800 levels. Break below 7800 will cause some panic sell off. Nifty may be heading towards 7600-7500.

You must read previous articles and watch the given chart carefully to understand this article completely.

For 13 October 2014: -
On 10 October 2014, FII Sold INR 719.77 crs and DII Bought INR 558.21 crs
Activities in global markets are favouring bears now. I have already said that we have a possibility of sell off in October month with end of QE program. So far, it goes right. We saw almost five bounce from the support area of 7850 to 7800 levels.
As shown in chart, we may see problem below 7800 levels. It is just about to break crucial moving average support. If it fails to revive from 7800 then a panic like situation is very likely. This situation arises due to large sell off in US market. Indian market has shown great resilience to save 7800 levels but odds are also too odd now.  
For today’s trading session, we may see opening on down side gap. If it can able to eat 7800 then we may see some rapid fall towards 7775 then towards 7700 levels. Hence, I am making this week as very crucial. In past few days we saw many gap up and gap down but nothing came below 7800 so far. Moving on higher side 7910 will act as stiff resistance. If opening goes below 7800 then 7840 will also act as stiff resistance for bulls.
Please visit our ‘intraday updates’ to get further updates or to take good advantage join paid services.
Strategy for Nifty October future – Nifty October future has support at 7850. If it takes out as gap down which is very likely then we may see selling intensify for 40-50 points more in the panic of long unwinding. Do we have a chance of trading after gap down? If gap down goes more than 1 % then one should opt to short in bounce only. Practically, 7850 – 7860 will act as resistance after opening.

S&P 500 (USA) – I have already quoted too many times about the possibility of fall towards 1905. Here it comes on Friday night. This is what I called as bull’s fear. I am expecting S&P to go as low as in the range of 1850 to 1800. Remember, it happened in past every times when QE ended. I am feeling that it is just repeating its pattern. With this blow it can end the possibility of quick recovery. Hence, I do not prefer to buy the dip for any quick gain except a small technical recovery but that’s also far from now. 

NIFTY weekly analysis for 13 October’14 to 17 October’14


Elliott wave theory: It has just closed near to 7850 levels. This is making charts concerning now. In fact, it was concerning at higher levels itself. It seems that we will start getting few closes below 7850 levels. If this happens then we can hope for a down side towards 7600-7500 levels sooner in few weeks.
Market cycle: Nifty is almost away by five weeks from its all-time high and practically it is heading for two month’s lowest levels. If you remember, Wolfe wave truncation has happened at this level itself. So it may take its effect anytime now.
Technical indicators: MACD and RSI are growing with negative divergence. This is alarming. This is prime reason that I am advising strong caution. This indication is running from past more than four weeks.

Charting pattern: I can still say that below 7850 on closing basis, Nifty should see a fall towards 7500-7600 levels. This may be due wide difference between moving average support. Reason of price fall can be anything. 

Friday, 10 October 2014

10 October 2014: Stock Chart Analysis for intraday – ONGC, BHEL and DRREDDY

ONGC (411.45)
Buy above 415/ SL 412/ Target 422-425|| Sell below 410/ SL 413/ Target 405-400


BHEL (219.05)
Buy above 221/SL 219/Target 225||Sell below 218/ SL 220/ Target 215-213


DRREDDY (2986.55)
Buy above 3002/SL 2995/ Target 3020-3030||Sell below 2980/ SL 2992/ Target 2950