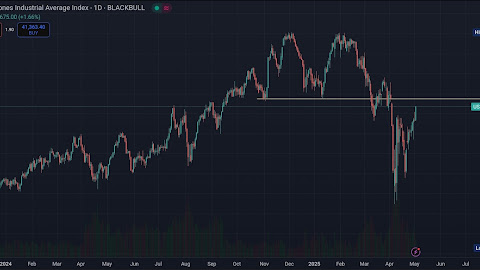
Dow Jones Eyes 5000-Point Rally: Inverse Head & Shoulders Breakout Ahead Dow Jones Industrial Average (DJIA) is displaying a classic Inverse…
About VieCapital – Nifty 50 & Stock Market Analysis Blog
Welcome to VieCapital, your trusted destination for in-depth stock market insights, Nifty 50 analysis, and smart trading strategies tailored for Indian markets. Whether you’re a beginner, seasoned trader, or long-term investor, our blog is designed to help you make informed decisions with well-researched market analysis, technical breakdowns.
how to read stock market charts, identify market trends, use technical indicators.
Praveen Kumar
I’m Praveen Kumar, a seasoned Technical Analyst and stock market trader with over 25 years of experience in the Indian equity and derivatives markets. My passion for numbers and patterns led me to a dual career as a Mathematics Teacher and market technician.
I specialize in Technical Analysis, with deep expertise in Elliott Wave Theory, derivatives strategies, and market forecasting. Over the years, my analysis and market views have been featured on NDTV Profit as a financial guest, along with published articles on reputed financial web portals, sharing insights on Nifty 50, Bank Nifty, and stock market trends.
As a trader and analyst, I focus on interpreting price action, chart patterns, wave counts, and technical indicators to deliver precise market levels and actionable trade ideas. My approach blends classical charting with modern analysis tools to help traders navigate market volatility.
Through VieCapital, I aim to share daily market analysis, trading strategies, and educatio…
The Dow Jones Industrial Average (DJIA) is poised for a potential pullback tonight as fresh tariff reinstatement news and critical technical re…
U.S. stock futures experienced a notable decline on May 23, 2025, driven by a confluence of economic, geopolitical, and corporate factors. Here…
Dow Jones (DJIA) Technical Analysis – May 23, 2025 Current Price: 39,850 Key Technical Indicators: 50-day Movin…
Dow Jones Faces Strong Rejection at 42,800: What's Next? Date: 22 May 2025 | Index: Dow Jones Industrial Average (DJIA) Key Technical O…
Date: 21 May 2025 Author: Praveen Kumar | viecapital.blogspot.com Market Overview The Dow Jones Industrial Average (DJIA) is approaching a c…
Dow Jones Industrial Average (DJI) Technical Analysis | May 20, 2025 The US stock market continues to show remarkable resilience as the Dow Jones I…
Price Action Current Price: 42,422.50 Resistance Level: 42,790.89 (very close to being tested — crucial zone) Support Zones: 41,757.27 (SMA 50) 41,65…
U.S. stock futures are up today, Monday, May 12, 2025, primarily due to a significant development in U.S.-China trade relations. Key Reasons for the…
Certainly! Here's the latest technical analysis for the Dow Jones Industrial Average (DJIA) as of May 2, 2025: 📊 Technical Indicators RSI (14-d…
Hello everyone, Since yesterday, I have often mentioned RSI divergence. The 15-minute, hourly, and daily time frames show this discrepancy. We w…
NIFTY HOURLY CHART DOW FUTURE HOURLY CHART Hello everyone, The hourly time frame comparison of the two charts is shown above. Nifty's outperfo…
Hello everyone, I see everything good on NIFTY but equally I found DJIA as bad as possible. It is trading below all crucial moving averages. You c…


.jfif)


