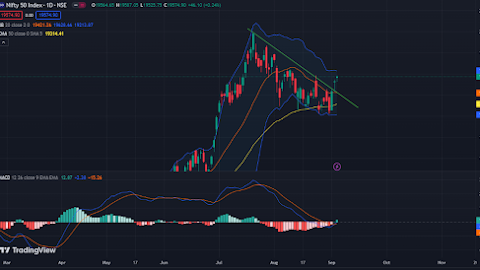
Hello, first of congratulations of 20000 on Nifty. What is coming next is the big question. In my view, 20000 is an important technical landmark o…
About VieCapital – Nifty 50 & Stock Market Analysis Blog
Welcome to VieCapital, your trusted destination for in-depth stock market insights, Nifty 50 analysis, and smart trading strategies tailored for Indian markets. Whether you’re a beginner, seasoned trader, or long-term investor, our blog is designed to help you make informed decisions with well-researched market analysis, technical breakdowns.
how to read stock market charts, identify market trends, use technical indicators.
Praveen Kumar
I’m Praveen Kumar, a seasoned Technical Analyst and stock market trader with over 25 years of experience in the Indian equity and derivatives markets. My passion for numbers and patterns led me to a dual career as a Mathematics Teacher and market technician.
I specialize in Technical Analysis, with deep expertise in Elliott Wave Theory, derivatives strategies, and market forecasting. Over the years, my analysis and market views have been featured on NDTV Profit as a financial guest, along with published articles on reputed financial web portals, sharing insights on Nifty 50, Bank Nifty, and stock market trends.
As a trader and analyst, I focus on interpreting price action, chart patterns, wave counts, and technical indicators to deliver precise market levels and actionable trade ideas. My approach blends classical charting with modern analysis tools to help traders navigate market volatility.
Through VieCapital, I aim to share daily market analysis, trading strategies, and educatio…
Hello everyone!!! This is going to be another exciting week of trading. So far, we have seen a gain of almost 600 points in the past six trading se…
Hello, I must say that when Nifty was saving 19250 and unable to close below 19250, that was a sign that the market may refuse to go down. I was not…
Hello, I am going to present views based on two charts. One is a Nifty daily chart and the other is an hourly chart. Let us first discuss the daily …
Very good morning and Happy Teacher's Day. What happened yesterday was a perfect example of the retest of support and bounce. What I feel now …
Friday's bounce is another attempt by the bulls to save support. It moved too far and went above 19400 levels. I see a threat unless it goes st…
The chart speaks louder than the words. So far, we have seen a 23.60% retracement of the whole recent rally. More than that, we saw multiple hits o…


