About VieCapital – Nifty 50 & Stock Market Analysis Blog
Welcome to VieCapital, your trusted destination for in-depth stock market insights, Nifty 50 analysis, and smart trading strategies tailored for Indian markets. Whether you’re a beginner, seasoned trader, or long-term investor, our blog is designed to help you make informed decisions with well-researched market analysis, technical breakdowns.
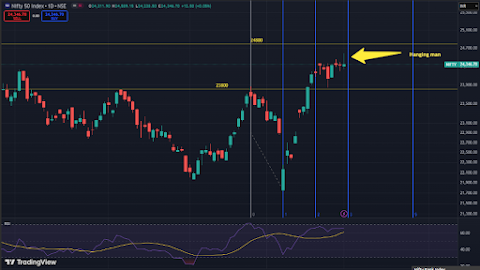
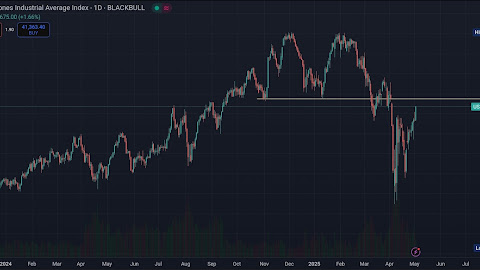
how to read stock market charts, identify market trends, use technical indicators.
I’m Praveen Kumar, a seasoned Technical Analyst and stock market trader with over 25 years of experience in the Indian equity and derivatives markets. My passion for numbers and patterns led me to a dual career as a Mathematics Teacher and market technician.
I specialize in Technical Analysis, with deep expertise in Elliott Wave Theory, derivatives strategies, and market forecasting. Over the years, my analysis and market views have been featured on NDTV Profit as a financial guest, along with published articles on reputed financial web portals, sharing insights on Nifty 50, Bank Nifty, and stock market trends.
As a trader and analyst, I focus on interpreting price action, chart patterns, wave counts, and technical indicators to deliver precise market levels and actionable trade ideas. My approach blends classical charting with modern analysis tools to help traders navigate market volatility.
Through VieCapital, I aim to share daily market analysis, trading strategies, and educatio…