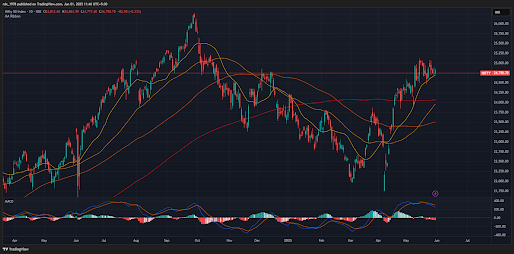
Nifty 50 Elliott Wave & Technical Outlook for June 2, 2025- Will correction begin or rise continues?
Nifty 50 Technical Outlook for June 2, 2025
The Indian stock market continues to ride its bullish momentum, with the Nifty 50 closing at 24,750 on Friday. As we step into the first full week of June, market participants are keenly watching key technical levels and indicator signals for direction. Global cues, religious holidays, and domestic political developments could also influence trading sentiment this week.
👉 In case you missed it, check our Nifty Elliott Wave Update and Key Levels for May 27–31, 2025 — where our bullish projections played out precisely!
Elliott Wave Count
- Nifty appears to be in Wave 3 of a larger 5-wave impulsive sequence.
- Wave 3 Target: 24,870–25,000
- Probability of completing Wave 3: 75%
- A minor Wave 4 consolidation may occur between 24,660–24,590.
- Wave 5 could potentially stretch towards 25,100–25,200 post consolidation.
Technical Levels
| Timeframe | Support Levels | Resistance Levels |
|---|---|---|
| Hourly | 24,660, 24,590 | 24,800, 24,870 |
| Daily | 24,590, 24,500 | 24,870, 25,000 |
| Weekly | 24,500, 24,200 | 25,000, 25,200 |
Indicator Studies
RSI (Relative Strength Index)
- Hourly RSI: 68 — nearing overbought, potential mild pullback
- Daily RSI: 64 — healthy bullish range
- Weekly RSI: 70 — overbought but strong uptrend; no divergence yet
MACD (Moving Average Convergence Divergence)
- Hourly MACD: Bullish crossover continues; histogram showing strength
- Daily MACD: Positive with widening gap between MACD and Signal line
- Weekly MACD: In strong uptrend territory since March
Bollinger Bands
- Hourly: Nifty hugging upper band near 24,800, indicating strength but risk of volatility increase
- Daily: Bands expanding — signaling a trending market
- Weekly: Wide spread, suggesting a continuation of trend with occasional volatility
Supertrend
- Hourly: Supertrend support at 24,660
- Daily: Positive trend intact since breaking 24,400
- Weekly: Bullish since April, support trailing at 23,800
Probability Table
| Level Break Scenario | Probability | Expected Move |
|---|---|---|
| Above 24,800 | 70% | 24,870–25,000 |
| Above 25,000 | 55% | 25,100–25,200 |
| Below 24,660 | 40% | 24,590 |
| Below 24,590 | 25% | 24,500 |
Conclusion
In conclusion, Nifty 50 retains its bullish bias heading into the week, with strong support at 24,660–24,590 and upside targets at 24,870–25,000. The indicator setup on RSI, MACD, and Supertrend confirms underlying strength, while the Bollinger Bands caution about rising volatility near upper levels.
👉 As highlighted in our previous week’s Nifty Elliott Wave outlook, the market's upward trajectory remains intact, and this week too promises momentum opportunities above crucial resistance levels.


Join the conversation