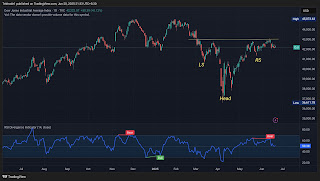
Dow Jones Industrial Average Outlook: Inverse Head & Shoulders Pattern Signals Possible Breakout | June 2025
Intro: The Dow Jones Industrial Average (DJI) has shown notable resilience in June 2025. A textbook Inverse Head and Shoulders pattern has formed on the chart, paired with RSI divergence and a critical breakout level near 43,000. This post breaks down the pattern, technical indicators, moving averages, and actionable levels for traders and investors.
Inverse Head & Shoulders Chart Pattern
The daily Dow Jones chart forms an Inverse Head & Shoulders:
- Left Shoulder (LS): Near 41,000
- Head: Around 36,600
- Right Shoulder (RS): At 41,200
- Neckline Resistance: 43,000
This bullish reversal signals a breakout on a neckline breach with a possible target towards 45,000+.
RSI Divergence & Momentum
The Relative Strength Index (RSI) currently reads 50.38. A bearish divergence was seen in early June as RSI failed to make higher highs while price attempted it, resulting in a short-term pullback. Watch for RSI reclaiming the 55-60 zone to confirm bullish momentum.
Moving Averages Overview
- 50-Day EMA: Near 41,900
- 200-Day EMA: Around 40,500
The Dow trades above both — indicating strength and support on pullbacks.
Key Support & Resistance Levels
| Support | Resistance | Breakout Zone |
|---|---|---|
| 41,200 | 43,000 | 43,050+ |
Supertrend Indicator (not visible in image but implied by EMA position) maintains a bullish bias unless 41,000 is decisively breached.
Conclusion
The Dow Jones Industrial Average showcases a reliable Inverse Head and Shoulders pattern. A breakout above 43,000 can trigger a rally to 45,000+. Traders should watch RSI strength and EMA supports for confirmation. A failure to cross could cause consolidation between 41,000-43,000. Stay tuned for updates. Do not opt buying here. Wait for break and then plan. If rsi divergence comes in to play, it can result well predicted ugly fall.
Follow us for real-time updates:
Disclaimer: This analysis is for educational purposes only. Please consult your financial advisor before investing.

Join the conversation