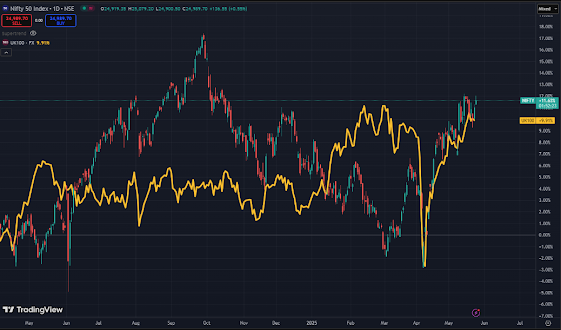
Nifty vs FTSE 100 Comparative Chart Analysis – May 2025 Outlook
As global markets remain sensitive to macroeconomic cues, relative strength between indices often highlights underlying opportunities. Today, we bring you a fresh comparative look at the Nifty 50 Index and the FTSE 100 (UKX), identifying their moves and upcoming possibilities with RSI divergence insights.
Recent Performance Overview:
- Nifty 50: At fresh local highs, delivering a solid +11.63% YTD performance.
- FTSE 100: Lagging with a -9.71% YTD dip.
Correlation Patterns:
- From July 2024 to December 2024, both indices moved largely in sync.
- Since February 2025, FTSE has underperformed while Nifty surged.
- Sharp dip around March 2025, followed by a strong Nifty recovery.
RSI Divergence Insight:
Relative Strength Index (RSI) divergence is a valuable momentum indicator. Key observations:
- Nifty's RSI remains in bullish territory, confirming strength.
- FTSE's RSI shows bearish divergence, explaining its weaker recovery.
RSI divergence confirms hidden market strength in Nifty — making it a better bet for bullish setups.
Current Chart Structure:
- Nifty 50: Consolidating near resistance highs — signs of a breakout attempt.
- FTSE 100: Modest recovery but still beneath prior swing highs.
What to Watch Next:
Scenario 1: Global Correlation Strengthens
- FTSE attempts a catch-up rally.
- Nifty sustains higher or mildly consolidates if global cues turn risk-off.
Scenario 2: Divergence Continues
- Confirms India’s outperformance.
- Nifty & Bank Nifty continues to lead the global rally.
Strategic Takeaway:
- Monitor RSI divergence and MACD crossovers on both indices.
- If FTSE breaks swing highs, global bullish momentum could return.
- If FTSE weakens while Nifty breaks out, India-centric trades remain best.
Conclusion:
Nifty 50 leads global indices in recovery strength. FTSE 100 lags, and unless it rallies beyond resistance, India-favored bullishness will persist.
This analysis offers strong cues for traders and investors in India, USA, UK, and Japan to align strategies accordingly.
🔵 Follow me on Twitter for daily trade setups: @viecapital

Join the conversation