Nifty 50 Technical Analysis for May 23, 2025: Is a Bearish Breakdown on the Horizon?
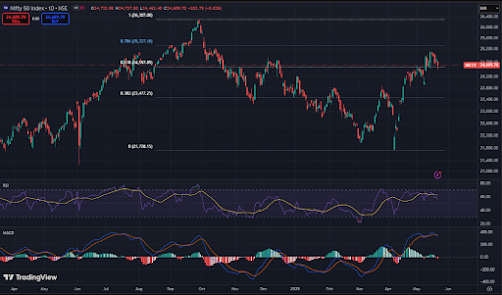
The Indian stock market witnessed heightened volatility today, with Nifty 50 closing at 24,609.70, down by 203.75 points (-0.82%). Technical indicators now suggest a cautious outlook for tomorrow, May 23, 2025. Here's a complete breakdown of the market setup, key levels, and possible scenarios.
What has happened in the last hour of expiry was defintely "a short covering" rise. It was well indicated by RSI on 15 minutes charts which Ihave updated on my twitter address. If you want to see my intraday update - follow me on twitter on my id https://x.com/viecapital.
Well, what's coming next? A big question.
The answer is not simple but straightforward. If this has to continue on the upside, it will face a hurdle at the 24800 to 24850 zone. Otherwise, we may see either a gap down or a dip in the very first hour.
Remember, 24400 was in action in the last hour of trade, saving the bulls. The question is for how long.
Key Levels for Nifty 50 on May 23, 2025
- Resistance 1: 24,850
- Resistance 2: 25,050
- Support 1: 24,470 (Fibonacci 0.618 level)
- Support 2: 24,200
- Breakdown Level: 24,470 (below which selling pressure may accelerate)
RSI Analysis
The Relative Strength Index (RSI) on the daily timeframe is hovering around 52, slipping from recent overbought conditions. This drop signals weakening bullish momentum, and a further dip below 50 would confirm a bearish bias for the short term.
MACD Analysis
The MACD has triggered a bearish crossover with the MACD line crossing below the signal line. The histogram is also declining, hinting at potential downside continuation. Momentum appears to be turning against the bulls.
Moving Averages
The Nifty is currently trading just above its 20-day EMA and 50-day EMA. If the index breaches the 24,470 support, it may trigger selling towards the 24,200 zone. This will definitely be a crucial one which will come in to play in next trading session.
Chart Pattern Outlook
The daily chart suggests a possible formation of a bearish double-top pattern near 25,050-25,100, followed by a rejection. If the index fails to reclaim 24,850 tomorrow, the risk of breakdown below 24,470 intensifies.
Latest Market-Moving Factors
- US Market Sell-off: Dow Jones slipped below 42,000 as shown in recent charts — raising concerns of global market weakness.
- Rupee Under Pressure: INR depreciation against USD might add selling pressure on Indian equities.
- FIIs Selling: Foreign investors turned net sellers in today's session.
Conclusion: Watch 24,470!
If Nifty 50 breaks below 24,470 decisively, expect accelerated selling toward 24,200. On the upside, a breakout above 24,850 might negate this bearish view. Traders should keep a close eye on RSI levels, MACD confirmation, and price action near the key support zone.
Disclaimer: This is a technical analysis study for educational purposes only. Trade at your own risk.
#Nifty50 #NiftyAnalysis #StockMarketIndia #TechnicalAnalysis #RSI #MACD #MovingAverages #NiftyBreakdown #IndianStockMarket #IntradayTrading #SwingTrading #NSEIndia
Subscribe for Nifty 50 Updates!
Related Reading:
For a detailed Elliott Wave analysis of Nifty 50, check out our recent post: Elliott Wave Nifty 50 — Current Wave Count & Future Projections.
Don’t miss our daily Nifty expiry option strategies, designed for both conservative and aggressive traders. Visit: Daily Nifty Option Strategy — Live Updates.
If you want to see how past FOMC meetings affected the Indian market, explore our archives here: FOMC Impact on Indian Markets — Historical Reactions.
Disclaimer
This analysis is for educational purposes only. Trading and investing involve risk. Please consult your financial advisor before making any decisions.

Join the conversation