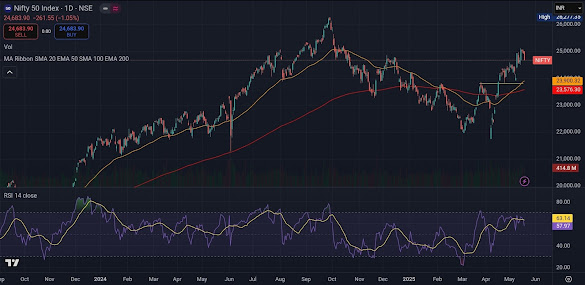
Nifty 50 Faces Resistance at 25,000 — RSI Divergence Hints at Possible Correction
“Bookmark this page and check back tomorrow for fresh analysis!”
As we step into a new trading session, the Nifty 50 is trading at a decisive technical zone. After a sharp rally from April lows, the index is consolidating within a tight range. With negative divergence in RSI and visible resistance near 25,000, tomorrow’s session could bring a directional move.
Let’sThe Indian stock market continues to keep traders on edge as the Nifty 50 hovers near the crucial 25,000 mark. After a sharp event-driven rally, the index is now showing early signs of fatigue. A noticeable RSI divergence has emerged on the daily chart, hinting at a possible short-term correction. In today’s post, we’ll decode the key levels, technical signals, and option strategies to help you navigate the market with confidence. dive into the technical levels, indicators, and actionable setups for 21 May 2025.
Nifty 50 Daily Chart Highlights (As of 20-May-2025)
Support & Resistance Levels
| Type | Price Zone (₹) |
|---|---|
| Major Resistance | 24,950–25,000 |
| Breakout Level | 25,000 |
| Upside Target | 25,150–25,250 |
| Immediate Support | 24,600 |
| Breakdown Level | 24,600 |
| Downside Target | 24,450–24,300 |
Technical Indicator Status
- RSI (14): 63.80 — Easing from overbought, showing negative divergence.
- MACD: In bullish territory, but histogram narrowing — indicating waning momentum.
- 20 EMA: 24,410 — Crucial dynamic support.
- 50 EMA: 23,800 — Medium-term trend support.
- 200 EMA: 23,350 — Long-term support base.
Actionable Trade Setups for 21 May 2025
Bullish Scenario:
- Buy above 24,950–25,000 with strong volume.
- Targets: 25,150–25,250
- Stop-loss: 24,800
Bearish Scenario:
- Sell below 24,600.
- Targets: 24,450–24,300
- Stop-loss: 24,750
Confirmation: Strong red candle with RSI below 60.
RSI Divergence Insight:
The RSI (14) indicator is currently at 57.97, with a recent peak at 63.14 when Nifty attempted a breakout near 25,000.
Observation:
There’s a bearish RSI divergence visible — while price made a new swing high, RSI failed to confirm with a higher high. This is a classic warning of potential momentum exhaustion.
Implication:
This divergence suggests a likely consolidation or short-term corrective move unless Nifty decisively crosses and sustains above 25,000 with strong volumes.
Final Thoughts
The Nifty 50 is currently stuck in a narrow band between 24,600–25,000. With RSI divergence and repeated upper wick candles, caution is advised for aggressive trades within this range. Tomorrow’s move beyond these levels can trigger a sharp intraday rally or a profit-booking wave.
With Nifty 50 approaching a major resistance zone and RSI divergence flashing early warning signs, traders should exercise caution on fresh longs near the 25,000 mark. A corrective move toward the 23,900–23,600 support zone could offer a healthy dip-buying opportunity in line with the broader uptrend. Keep a close eye on price action around these levels and adjust your option strategies accordingly for expiry weeks ahead.
Stay Updated!
Bookmark this blog and subscribe for daily Nifty 50 analysis, option chain insights, and trading strategies.
Happy Trading!
Nifty 50 analysis, Nifty levels, Nifty support and resistance, Nifty tomorrow prediction, Nifty technical outlook, RSI divergence, Nifty breakout levels, Indian stock market analysis, 21 May Nifty outlook, Nifty futures strategy.

Join the conversation