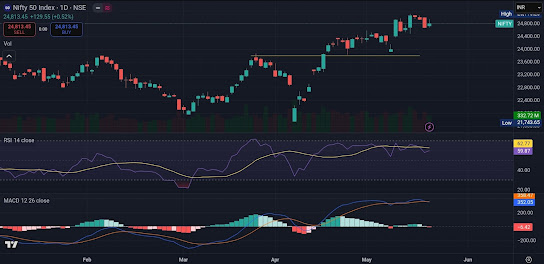
NIFTY 22 MAY 2025 : Crucial technical indicators says momentum is cooling off now. Hence word of caution. Below 24700, it can test 24400.
Nifty 50 Technical Outlook: Caution Ahead as Momentum Cools — Key Levels to Watch
Market Overview:
The Nifty 50 index continued to hold steady, closing at 24,813.45, up by +129.55 points (+0.52%). Despite this positive close, key technical indicators hint at slowing momentum, raising caution for traders ahead of the highly anticipated FOMC meeting outcome.
Market Behavior Insight:
If you closely observe recent market patterns, you’ll notice that Nifty tends to bounce in the first half but eventually closes toward the day’s lower levels. This is a clear sign that smart money or institutional players are selling into intraday rallies.
Adding to this, the FII (Foreign Institutional Investors) positioning has turned net short on index futures, a critical factor contributing to the narrowing premium in Nifty May Futures. With a week left for expiry, this premium could even turn into a discount of 40–50 points if this selling pressure persists.
Previously, I had highlighted that buyers hold the advantage as long as Nifty stays above 23,800. However, based on the latest price action and indicator behavior, I’m revising this threshold — 24,400 now becomes the final line of hope for bulls. A sustained move below this could shift the momentum entirely in favor of the bears.
Also, don’t overlook the RSI divergence forming on both the daily and hourly charts, a pattern I’ve been flagging consistently. If you haven’t yet, make sure to check my detailed explanation on this in the 3M Elliott Wave chart analysis — link shared below.
Technical Indicators:
1. Relative Strength Index (RSI - 14)
- Current Value: 59.87
- The RSI has slipped below the critical 60 mark, signaling a mild weakening in buying strength. While still in bullish territory, a fall below 58 could trigger short-term consolidation or mild profit booking.
2. MACD (12,26,9)
- MACD Line: 358.47
- Signal Line: 352.05
- Histogram: -6.42 (bearish divergence forming)
- The MACD is on the verge of a bearish crossover, which, if confirmed, could indicate a temporary pause in the rally or a correction phase.
3. Moving Average & Key Price Levels
- The index continues to trade well above previous breakout levels around 24,400.
- Immediate support lies at 24,400–24,500, followed by a major support near 24,000.
- Sustaining above 24,800 will be essential to keep bullish momentum intact in the short term.
What to Expect Ahead of the FOMC Meeting:
Global markets, including Indian equities, remain cautious ahead of the US Federal Reserve’s interest rate decision. While no rate hike is expected, any hints of a hawkish stance could spark volatility.
Key scenarios to watch:
- A dovish Fed could push Nifty past 24,900 toward 25,050.
- A hawkish surprise may drag the index back toward the 24,400–24,000 support zone.
Final Verdict:
- Short-Term Bias: Cautious
- Medium-Term Trend: Bullish (as long as above 24,000)
- Action Point: Traders should closely monitor the 24,400–24,500 zone. Fresh long positions should only be considered on a breakout above 24,900 with strong volumes.
Related Reading:
For a detailed Elliott Wave analysis of Nifty 50, check out our recent post: Elliott Wave Nifty 50 — Current Wave Count & Future Projections.
Don’t miss our daily Nifty expiry option strategies, designed for both conservative and aggressive traders. Visit: Daily Nifty Option Strategy — Live Updates.
If you want to see how past FOMC meetings affected the Indian market, explore our archives here: FOMC Impact on Indian Markets — Historical Reactions.
Disclaimer
This analysis is for educational purposes only. Trading and investing involve risk. Please consult your financial advisor before making any decisions.

Join the conversation