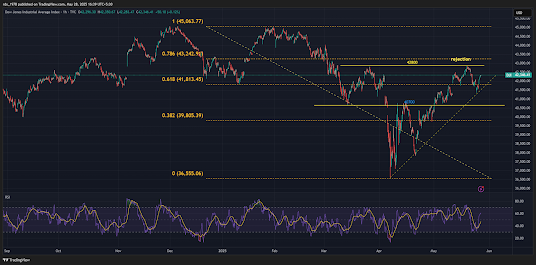
Dow Jones Industrial Average (DJI) Analysis: Don't get tempted with this rise. It can see bigger correction sooner.
The Dow Jones Industrial Average witnessed a strong bullish surge in today’s session, extending its recent uptrend and approaching a critical resistance zone. With the index comfortably trading above the key 42,300 mark, market participants showed renewed buying interest, possibly fueled by positive global cues and improved investor sentiment. As the index inches closer to the significant 0.786 Fibonacci retracement level, traders are closely watching for signs of a breakout or a potential rejection from this overhead supply zone.
Key Technical Observations:
-
Current Price:
- Fibonacci Levels (from high at 45,063.77 to low at 36,555.06
0.382 at 39,805.39 → Held as intermediate support earlier
- Key Price Levels:
42,800 Zone: Marked as a rejection point — market previously faced resistance here.
41,700-41,800 Zone: Previous breakout area and support.
40,700: Former base for this up-leg.Currently above 70, indicating overbought conditions — signalling potential for a pullback or consolidation near this resistance.
Trendline:
The ascending trendline from the April lows remains intact — positive structure as long as this holds.
Yesterday's Move Summary:
- Strong upward move, breaking above the recent swing highs.
- Price is challenging the 42,800-43,242 (0.786 Fib) resistance area.
- RSI is stretched, suggesting the move may be overextended intraday.
- Market reacting bullishly possibly due to favorable US futures/global sentiment/earnings data — would need to verify catalysts.
What to Watch Next:
If It Breaks 43,242 Cleanly:
- Next immediate upside targets:
- 43,800
- 44,300
- 45,063 (recent high)
If It Fails to Hold 42,800-43,000 Area:
Likely retracement towards:
42,300 (today’s breakout area)- 41,800 (critical support — 0.618 Fib)
Conclusion:
Intraday traders should watch for profit-booking signals (bearish engulfing/rejection wicks) around current levels.
In summary, the Dow Jones continues to maintain its bullish momentum, but with the index now testing a crucial resistance zone near the 43,200–43,250 range, caution is warranted. Overbought RSI levels suggest the possibility of a short-term pullback or consolidation before any decisive move higher. A clean breakout above this resistance could open doors for a rally towards 43,800 and beyond, while failure to sustain these levels might trigger profit booking towards 42,300–41,800 support zones. Traders should remain vigilant and adapt their intraday strategies accordingly as the market approaches this pivotal technical juncture.


Join the conversation